I have a habit of skimming the OpenJDK commit log every few weeks. Many commits are too complex for me to grasp in the limited time I have reserved for this ... special hobby. But occasionally something catches my eye.
Last week, this commit stopped me mid-scroll:
858d2e434dd 8372584: [Linux]: Replace reading proc to get thread CPU
time with clock_gettime
The diffstat was interesting: +96 insertions, -54 deletions. The changeset adds a 55-line JMH benchmark, which means the production code itself is actually reduced.
The Deleted Code
Here's what got removed from os_linux.cpp:
static jlong user_thread_cpu_time(Thread *thread) {
pid_t tid = thread->osthread()->thread_id();
char *s;
char stat[2048];
size_t statlen;
char proc_name[64];
int count;
long sys_time, user_time;
char cdummy;
int idummy;
long ldummy;
FILE *fp;
os::snprintf_checked(proc_name, 64, "/proc/self/task/%d/stat", tid);
fp = os::fopen(proc_name, "r");
if (fp == nullptr) return -1;
statlen = fread(stat, 1, 2047, fp);
stat[statlen] = '\0';
fclose(fp);
// Skip pid and the command string. Note that we could be dealing with
// weird command names, e.g. user could decide to rename java launcher
// to "java 1.4.2 :)", then the stat file would look like
// 1234 (java 1.4.2 :)) R ... ...
// We don't really need to know the command string, just find the last
// occurrence of ")" and then start parsing from there. See bug 4726580.
s = strrchr(stat, ')');
if (s == nullptr) return -1;
// Skip blank chars
do { s++; } while (s && isspace((unsigned char) *s));
count = sscanf(s,"%c %d %d %d %d %d %lu %lu %lu %lu %lu %lu %lu",
&cdummy, &idummy, &idummy, &idummy, &idummy, &idummy,
&ldummy, &ldummy, &ldummy, &ldummy, &ldummy,
&user_time, &sys_time);
if (count != 13) return -1;
return (jlong)user_time * (1000000000 / os::Posix::clock_tics_per_second());
}
This was the implementation behind ThreadMXBean.getCurrentThreadUserTime(). To get the current thread's user CPU time, the old code was:
- Formatting a path to
/proc/self/task/<tid>/stat - Opening that file
- Reading into a stack buffer
- Parsing through a hostile format where the command name can contain parentheses (hence the
strrchrfor the last)) - Running
sscanfto extract fields 13 and 14 - Converting clock ticks to nanoseconds
For comparison, here's what getCurrentThreadCpuTime() does and has always done:
jlong os::current_thread_cpu_time() {
return os::Linux::thread_cpu_time(CLOCK_THREAD_CPUTIME_ID);
}
jlong os::Linux::thread_cpu_time(clockid_t clockid) {
struct timespec tp;
clock_gettime(clockid, &tp);
return (jlong)(tp.tv_sec * NANOSECS_PER_SEC + tp.tv_nsec);
}
Just a single clock_gettime() call. There is no file I/O, no complex parsing and no buffer to manage.
The original bug report, filed back in 2018, quantified the difference:
"getCurrentThreadUserTime is 30x-400x slower than getCurrentThreadCpuTime"
The gap widens under concurrency. Why is clock_gettime() so much faster? Both approaches require kernel entry, but the difference is in what happens next.
The /proc path:
open()syscall- VFS dispatch + dentry lookup
- procfs synthesizes file content at read time
- kernel formats string into buffer
read()syscall, copy to userspace- userspace
sscanf()parsing close()syscall
The clock_gettime(CLOCK_THREAD_CPUTIME_ID) path:
- single syscall →
posix_cpu_clock_get()→cpu_clock_sample()→task_sched_runtime()→ reads directly fromsched_entity
The /proc path involves multiple syscalls, VFS machinery, string formatting kernel-side, and parsing userspace-side. The clock_gettime() path is one syscall with a direct function call chain.
Under concurrent load, the /proc approach also suffers from kernel lock contention. The bug report notes:
"Reading proc is slow (hence why this procedure is put under the method slow_thread_cpu_time(...)) and may lead to noticeable spikes in case of contention for kernel resources."
Why Two Implementations?
So why didn't getCurrentThreadUserTime() just use clock_gettime() from the start?
The answer is (probably) POSIX. The standard mandates that CLOCK_THREAD_CPUTIME_ID returns total CPU time (user + system). There's no portable way to request user time only. Hence the /proc-based implementation.
The Linux port of OpenJDK isn't limited to what POSIX defines, it can use Linux-specific features. Let's see how.
The Clockid Bit Hack
Linux kernels since 2.6.12 (released in 2005) encode clock type information directly into the clockid_t value. When you call pthread_getcpuclockid(), you get back a clockid with a specific bit pattern:
Bit 2: Thread vs process clock
Bits 1-0: Clock type
00 = PROF
01 = VIRT (user time only)
10 = SCHED (user + system, POSIX-compliant)
11 = FD
The remaining bits encode the target PID/TID. We’ll come back to that in the bonus section.
The POSIX-compliant pthread_getcpuclockid() returns a clockid with bits 10 (SCHED). But if you flip those low bits to 01 (VIRT), clock_gettime() will return user time only.
The new implementation:
static bool get_thread_clockid(Thread* thread, clockid_t* clockid, bool total) {
constexpr clockid_t CLOCK_TYPE_MASK = 3;
constexpr clockid_t CPUCLOCK_VIRT = 1;
int rc = pthread_getcpuclockid(thread->osthread()->pthread_id(), clockid);
if (rc != 0) {
// Thread may have terminated
assert_status(rc == ESRCH, rc, "pthread_getcpuclockid failed");
return false;
}
if (!total) {
// Flip to CPUCLOCK_VIRT for user-time-only
*clockid = (*clockid & ~CLOCK_TYPE_MASK) | CPUCLOCK_VIRT;
}
return true;
}
static jlong user_thread_cpu_time(Thread *thread) {
clockid_t clockid;
bool success = get_thread_clockid(thread, &clockid, false);
return success ? os::Linux::thread_cpu_time(clockid) : -1;
}
And that's it. The new version has no file I/O, no buffer and certainly no sscanf() with thirteen format specifiers.
Profiling time!
Let's have a look at how it performs in practice. For this exercise, I am taking the JMH test included in the fix, the only change is that I increased the number of threads from 1 to 16
and added a main() method for simple execution from an IDE:
@State(Scope.Benchmark)
@Warmup(iterations = 2, time = 5)
@Measurement(iterations = 5, time = 5)
@BenchmarkMode(Mode.SampleTime)
@OutputTimeUnit(TimeUnit.MICROSECONDS)
@Threads(16)
@Fork(value = 1)
public class ThreadMXBeanBench {
static final ThreadMXBean mxThreadBean = ManagementFactory.getThreadMXBean();
static long user; // To avoid dead-code elimination
@Benchmark
public void getCurrentThreadUserTime() throws Throwable {
user = mxThreadBean.getCurrentThreadUserTime();
}
public static void main(String[] args) throws RunnerException {
Options opt = new OptionsBuilder()
.include(ThreadMXBeanBench.class.getSimpleName())
.build();
new Runner(opt).run();
}
}
Aside: This is a rather unscientific benchmark, I have other processes running on my desktop etc. Anyway, here is the setup: Ryzen 9950X, JDK main branch at commit 8ab7d3b89f656e5c. For the "before" case, I reverted the fix rather than checking out an older revision.
Here is the result:
Benchmark Mode Cnt Score Error Units
ThreadMXBeanBench.getCurrentThreadUserTime sample 8912714 11.186 ± 0.006 us/op
ThreadMXBeanBench.getCurrentThreadUserTime:p0.00 sample 2.000 us/op
ThreadMXBeanBench.getCurrentThreadUserTime:p0.50 sample 10.272 us/op
ThreadMXBeanBench.getCurrentThreadUserTime:p0.90 sample 17.984 us/op
ThreadMXBeanBench.getCurrentThreadUserTime:p0.95 sample 20.832 us/op
ThreadMXBeanBench.getCurrentThreadUserTime:p0.99 sample 27.552 us/op
ThreadMXBeanBench.getCurrentThreadUserTime:p0.999 sample 56.768 us/op
ThreadMXBeanBench.getCurrentThreadUserTime:p0.9999 sample 79.709 us/op
ThreadMXBeanBench.getCurrentThreadUserTime:p1.00 sample 1179.648 us/op
We can see that a single invocation took 11 microseconds on average and the median was about 10 microseconds per invocation.
The CPU profile looks like this:

The CPU profile confirms that each invocation of getCurrentThreadUserTime() does multiple syscalls. In fact, most of the CPU time
is spent in syscalls. We can see files being opened and closed. Closing alone results in multiple syscalls, including futex locks.
Let's see the benchmark result with the fix applied:
Benchmark Mode Cnt Score Error Units
ThreadMXBeanBench.getCurrentThreadUserTime sample 11037102 0.279 ± 0.001 us/op
ThreadMXBeanBench.getCurrentThreadUserTime:p0.00 sample 0.070 us/op
ThreadMXBeanBench.getCurrentThreadUserTime:p0.50 sample 0.310 us/op
ThreadMXBeanBench.getCurrentThreadUserTime:p0.90 sample 0.440 us/op
ThreadMXBeanBench.getCurrentThreadUserTime:p0.95 sample 0.530 us/op
ThreadMXBeanBench.getCurrentThreadUserTime:p0.99 sample 0.610 us/op
ThreadMXBeanBench.getCurrentThreadUserTime:p0.999 sample 1.030 us/op
ThreadMXBeanBench.getCurrentThreadUserTime:p0.9999 sample 3.088 us/op
ThreadMXBeanBench.getCurrentThreadUserTime:p1.00 sample 1230.848 us/op
The average went down from 11 microseconds to 279 nanos. This means the latency of the fixed version is 40x lower than the old version. While this is not a 400x improvement, it's within the 30x - 400x range from the original report. Chances are the delta would be higher with a different setup. Let's have a look at the new profile:

The profile is much cleaner. There is just a single syscall. If the profile is to be trusted then most of the time is spent in JVM, outside of the kernel.
How Documented Is This?
Barely. The bit encoding is stable. It hasn't changed in 20 years, but you won't find it in the clock_gettime(2) man page.
The closest thing to official documentation is the kernel source itself, in kernel/time/posix-cpu-timers.c and the CPUCLOCK_* macros.
The kernel's policy is clear: don't break userspace.
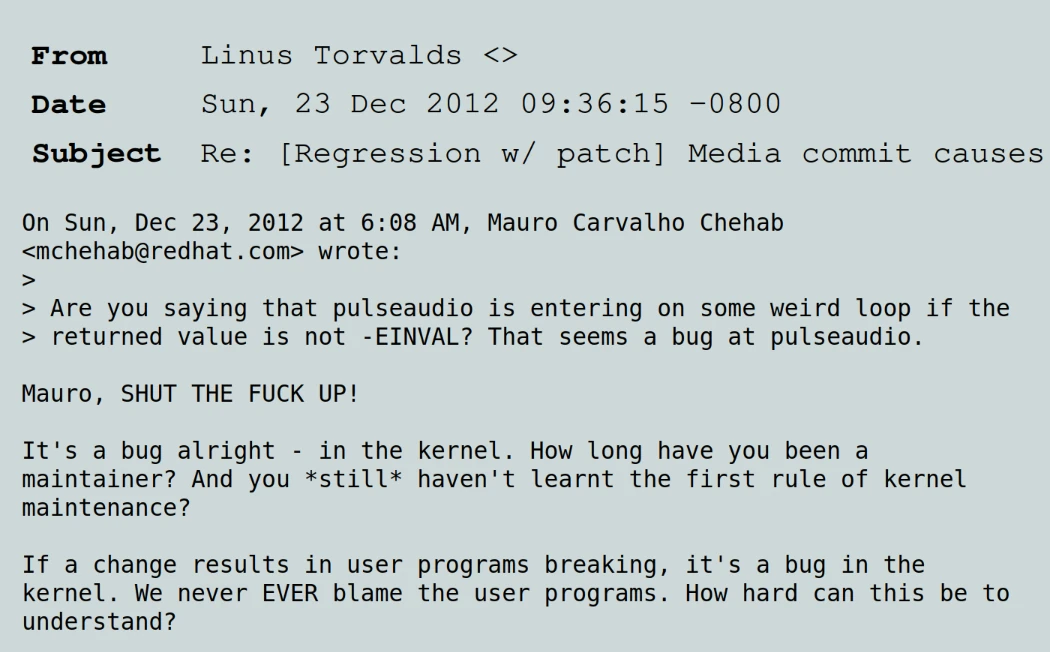
My take: If glibc depends on it, it's not going away.
Pushing Further
When looking at profiler data from the 'after' run, I spotted a further optimization opportunity: A good portion of the remaining syscall is spent inside a radix tree lookup. Have a look:
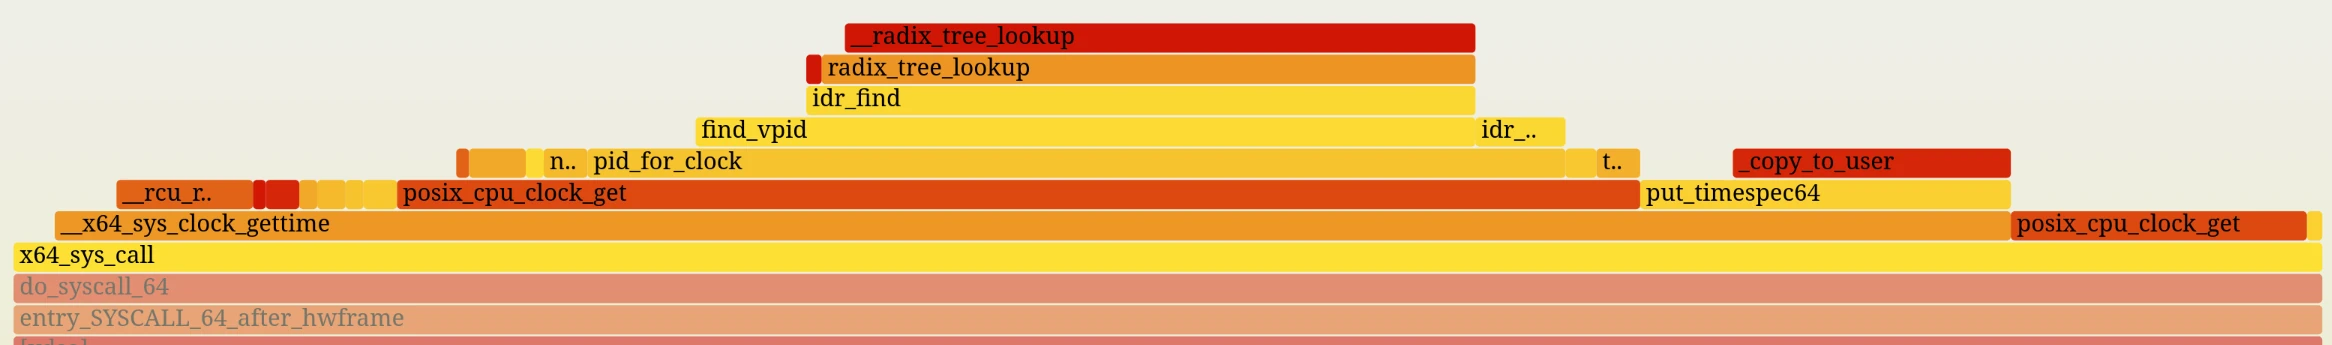
When the JVM calls pthread_getcpuclockid(), it receives a clockid that encodes the thread's ID. When this clockid is passed to clock_gettime(),
the kernel extracts the thread ID and performs a radix tree lookup to find the pid structure associated with that ID.
However, the Linux kernel has a fast-path. If the encoded PID in the clockid is 0, the kernel interprets this as "the current thread" and skips the radix tree lookup entirely, jumping to the current task's structure directly.
The OpenJDK fix currently obtains the specific TID, flips the bits, and passes it to clock_gettime(). This forces the kernel to take the "generalized path" (the radix tree lookup).
The source code looks like this:
/*
* Functions for validating access to tasks.
*/
static struct pid *pid_for_clock(const clockid_t clock, bool gettime)
{
[...]
/*
* If the encoded PID is 0, then the timer is targeted at current
* or the process to which current belongs.
*/
if (upid == 0)
// the fast path: current task lookup, cheap
return thread ? task_pid(current) : task_tgid(current);
// the generalized path: radix tree lookup, more expensive
pid = find_vpid(upid);
[...]
If the JVM constructed the entire clockid manually with PID=0 encoded (rather than obtaining the clockid via pthread_getcpuclockid()), the kernel could take the fast-path and avoid the radix tree lookup altogether.
The JVM already pokes bits in the clockid, so constructing it entirely from scratch wouldn't be a bigger leap compatibility-wise.
Let's try it!
First, a refresher on the clockid encoding. The clockid is constructed like this:
clockid for TID=42, user-time-only:
1111_1111_1111_1111_1111_1110_1010_1101
└───────────────~42────────────────┘│└┘
│ └─ 01 = VIRT (user time only)
└─── 1 = per-thread
For the current thread, we want PID=0 encoded, which gives ~0 in the upper bits:
1111_1111_1111_1111_1111_1111_1111_1101
└─────────────── ~0 ───────────────┘│└┘
│ └─ 01 = VIRT (user time only)
└─── 1 = per-thread
We can translate this into C++ as follows:
// Linux Kernel internal bit encoding for dynamic CPU clocks:
// [31:3] : Bitwise NOT of the PID or TID (~0 for current thread)
// [2] : 1 = Per-thread clock, 0 = Per-process clock
// [1:0] : Clock type (0 = PROF, 1 = VIRT/User-only, 2 = SCHED)
static_assert(sizeof(clockid_t) == 4, "Linux clockid_t must be 32-bit");
constexpr clockid_t CLOCK_CURRENT_THREAD_USERTIME = static_cast<clockid_t>(~0u << 3 | 4 | 1);
And then make a tiny teensy change to user_thread_cpu_time():
jlong os::current_thread_cpu_time(bool user_sys_cpu_time) {
if (user_sys_cpu_time) {
return os::Linux::thread_cpu_time(CLOCK_THREAD_CPUTIME_ID);
} else {
- return user_thread_cpu_time(Thread::current());
+ return os::Linux::thread_cpu_time(CLOCK_CURRENT_THREAD_USERTIME);
}
The change above is sufficient to make getCurrentThreadUserTime() use the fast-path in the kernel.
Given that we are in nanoseconds territory already, we tweak the test a bit:
- Increase the iteration and fork count
- Use just a single thread to minimize noise
- Switch to nanos
The benchmark changes are meant to eliminate noise from the rest of my system and get a more precise measurement of the small delta we expect:
@State(Scope.Benchmark)
@Warmup(iterations = 4, time = 5)
@Measurement(iterations = 10, time = 5)
@BenchmarkMode(Mode.SampleTime)
@OutputTimeUnit(TimeUnit.NANOSECONDS)
@Threads(1)
@Fork(value = 3)
public class ThreadMXBeanBench {
static final ThreadMXBean mxThreadBean = ManagementFactory.getThreadMXBean();
static long user; // To avoid dead-code elimination
@Benchmark
public void getCurrentThreadUserTime() throws Throwable {
user = mxThreadBean.getCurrentThreadUserTime();
}
public static void main(String[] args) throws RunnerException {
Options opt = new OptionsBuilder()
.include(ThreadMXBeanBench.class.getSimpleName())
.build();
new Runner(opt).run();
}
}
The version currently in JDK main branch gives:
Benchmark Mode Cnt Score Error Units
ThreadMXBeanBench.getCurrentThreadUserTime sample 4347067 81.746 ± 0.510 ns/op
ThreadMXBeanBench.getCurrentThreadUserTime:p0.00 sample 69.000 ns/op
ThreadMXBeanBench.getCurrentThreadUserTime:p0.50 sample 80.000 ns/op
ThreadMXBeanBench.getCurrentThreadUserTime:p0.90 sample 90.000 ns/op
ThreadMXBeanBench.getCurrentThreadUserTime:p0.95 sample 90.000 ns/op
ThreadMXBeanBench.getCurrentThreadUserTime:p0.99 sample 90.000 ns/op
ThreadMXBeanBench.getCurrentThreadUserTime:p0.999 sample 230.000 ns/op
ThreadMXBeanBench.getCurrentThreadUserTime:p0.9999 sample 1980.000 ns/op
ThreadMXBeanBench.getCurrentThreadUserTime:p1.00 sample 653312.000 ns/op
With the manual clockid construction, which uses the kernel fast-path, we get:
Benchmark Mode Cnt Score Error Units
ThreadMXBeanBench.getCurrentThreadUserTime sample 5081223 70.813 ± 0.325 ns/op
ThreadMXBeanBench.getCurrentThreadUserTime:p0.00 sample 59.000 ns/op
ThreadMXBeanBench.getCurrentThreadUserTime:p0.50 sample 70.000 ns/op
ThreadMXBeanBench.getCurrentThreadUserTime:p0.90 sample 70.000 ns/op
ThreadMXBeanBench.getCurrentThreadUserTime:p0.95 sample 70.000 ns/op
ThreadMXBeanBench.getCurrentThreadUserTime:p0.99 sample 80.000 ns/op
ThreadMXBeanBench.getCurrentThreadUserTime:p0.999 sample 170.000 ns/op
ThreadMXBeanBench.getCurrentThreadUserTime:p0.9999 sample 1830.000 ns/op
ThreadMXBeanBench.getCurrentThreadUserTime:p1.00 sample 425472.000 ns/op
The average went down from 81.7 ns to 70.8 ns, so about a 13% improvement. The improvements are visible across all percentiles as well.
Is it worth the loss of clarity from constructing the clockid manually rather than using pthread_getcpuclockid()?
I am not entirely sure. The absolute gain is small and makes additional assumptions about kernel internals, including the size of clockid_t. On the other hand, it's still a gain without any downside in practice. (famous last words...)
Browsing for Gems
This is why I like browsing commits of large open source projects. A 40-line deletion eliminated a 400x performance gap. The fix required no new kernel features, just knowledge of a stable-but-obscure Linux ABI detail.
The lessons:
Read the kernel source. POSIX tells you what's portable. The kernel source code tells you what's possible. Sometimes there's a 400x difference between the two. Whether it is worth exploiting is a different question.
Check the old assumptions. The /proc parsing approach made sense when it was written, before anyone realized it could be exploited this way. Assumptions get baked into code. Revisiting them occasionally pays off.
The change landed on December 3, 2025. Just one day before the JDK 26 feature freeze. If you're using ThreadMXBean.getCurrentThreadUserTime(), JDK 26 (releasing March 2026) brings you a free 30-400x speedup!