How Climate Resilient Are the Largest Cities?
Climate Risk and Adaptation in Global Cities
1. Executive Summary
This report analyzes the 72 of the world’s largest cities through the lens of AlphaGeo’s Climate Risk & Resilience Index (CRRI). It separates raw physical exposure from resilience-adjusted risk (RAJ) — what we call the adaptation delta — to reveal which cities are genuinely protected and which face a dangerous gap between their risk profile and their adaptive capacity.
Key Takeaways
- Geography is not destiny. Cities with near-identical physical risk scores diverge by as much as 33 RAJ points depending on the adaptation measures in place — demonstrating that risk is not fixed, and that resilience is a function of policy and investment, not geography alone.
- South Asian megacities face a compounding crisis. Ahmedabad (RAJ 41), Hyderabad Pakistan (41), Multan (38), Dhaka (36), Kolkata (35), and Lahore (35) combine extreme physical exposure with only moderate adaptation performance.
- European, African, and Latin American capitals outperform. Chicago, Addis Ababa, Melbourne, Barcelona, Buenos Aires, Paris, and Nairobi all score below 14 on the RAJ scale, making them among the most resilient major cities globally.
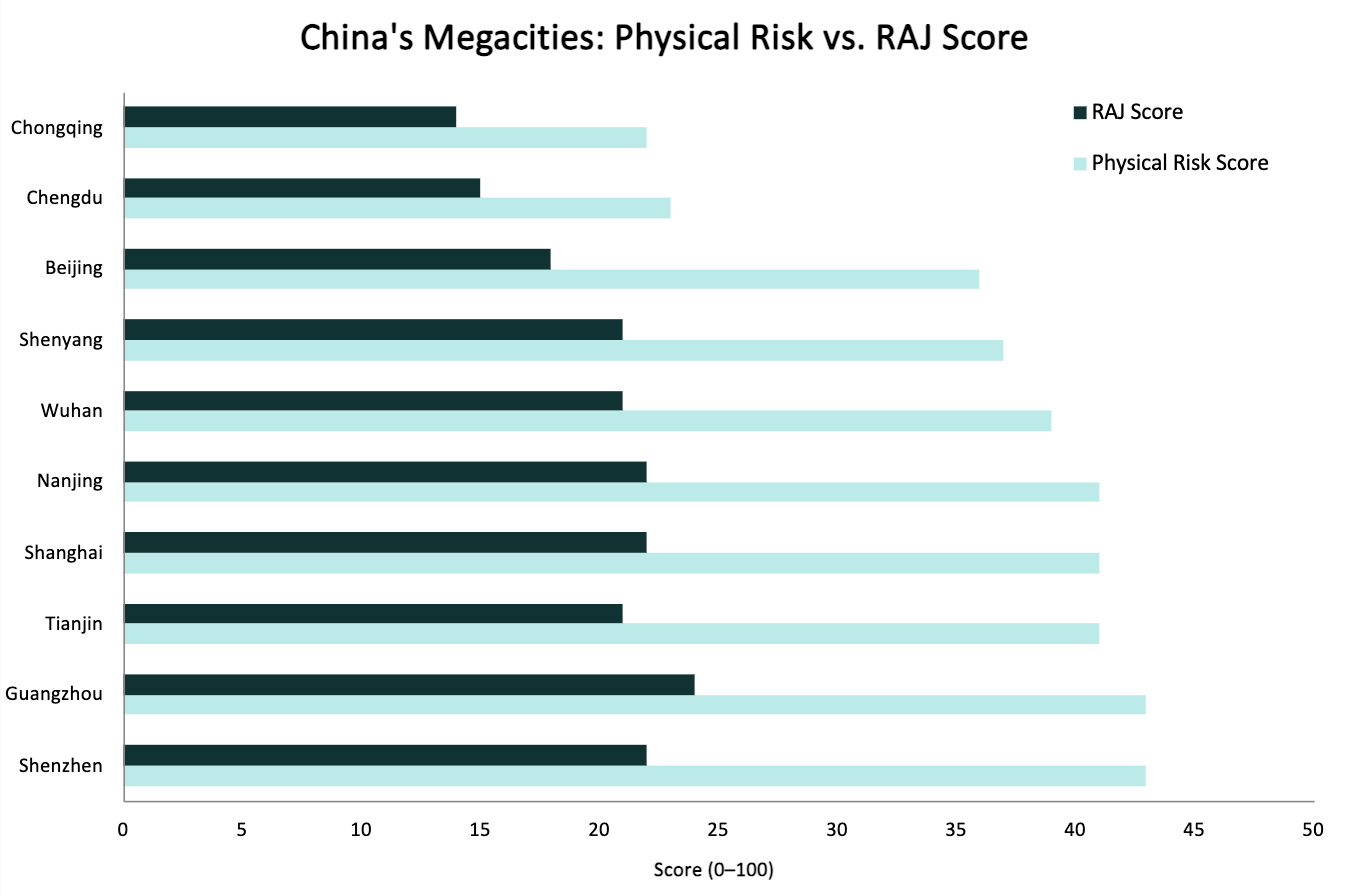
- Chinese megacities are closing the gap. Beijing (50%), Tianjin (49%), Shenzhen (49%), and Shanghai (46%) lead globally on adaptation efficiency — consistently converting high physical exposure into substantially lower residual risk.
- Mispriced risk is concentrated in South Asia. South Asia accounts for the majority of cities where residual RAJ scores remain high and adaptation rates remain comparatively low relative to the scale of physical exposure.
An important caveat: Scores in this report reflect city-level averages — risk can vary within cities, down to the neighbourhood or street level. To explore any city in greater detail, you can access address-level scores via a free, zero-commitment trial of our platform: app.alphageo.ai/trial_setup
2. Methodology
2.1 Data Source
All climate risk scores in this report are derived from AlphaGeo’s Climate Risk & Resilience Index (CRRI), a global proprietary dataset.
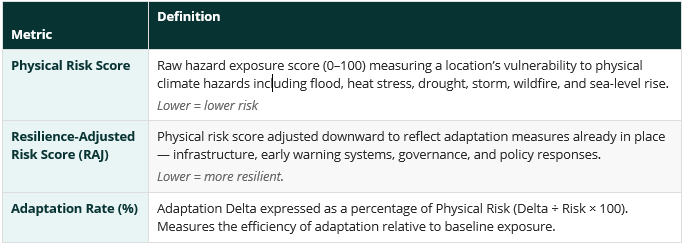
This report scores each city across six physical climate risk hazard layers — including inland and coastal flood, heat stress, drought, wildfires, and hurricane wind — with a unique, proprietary dataset on location adaptation capacity to produce both a:
a. Physical risk score (i.e., unmitigated risk); and
b. Resilience-adjusted Risk Score (RAJ, i.e., mitigated risk)
More on AlphaGeo’s Resilience-adjusted Risk methodology here: Learn more.
2.2 Score Definitions
An important caveat: Scores in this report reflect city-level averages — risk can vary within cities, down to the neighbourhood or street level. To explore any city in greater detail, you can access address-level scores via a free, zero-commitment trial of our platform: app.alphageo.ai/trial_setup
2.3 Score Categories
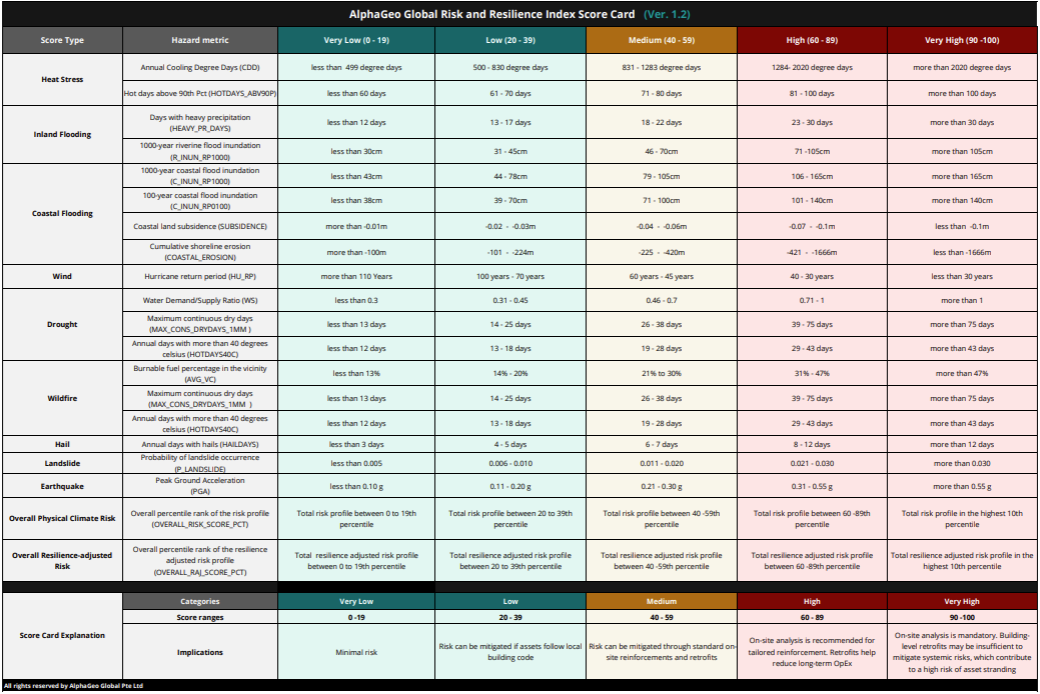
The diagram below shows how CRRI scores map to risk tiers across each hazard type. Scores are expressed as global percentiles (0–100) relative to AlphaGeo’s full global dataset.
3. Global Overview: Risk and Resilience Across the World’s Largest Cities
The scatter plot below plots each city’s physical risk score against its resilience-adjusted risk (RAJ). Cities below the diagonal line have successfully reduced risk through adaptation measures. The further below the line, the more effective the adaptation. Cities close to the line show limited measurable reduction in baseline exposure relative to their physical risk.
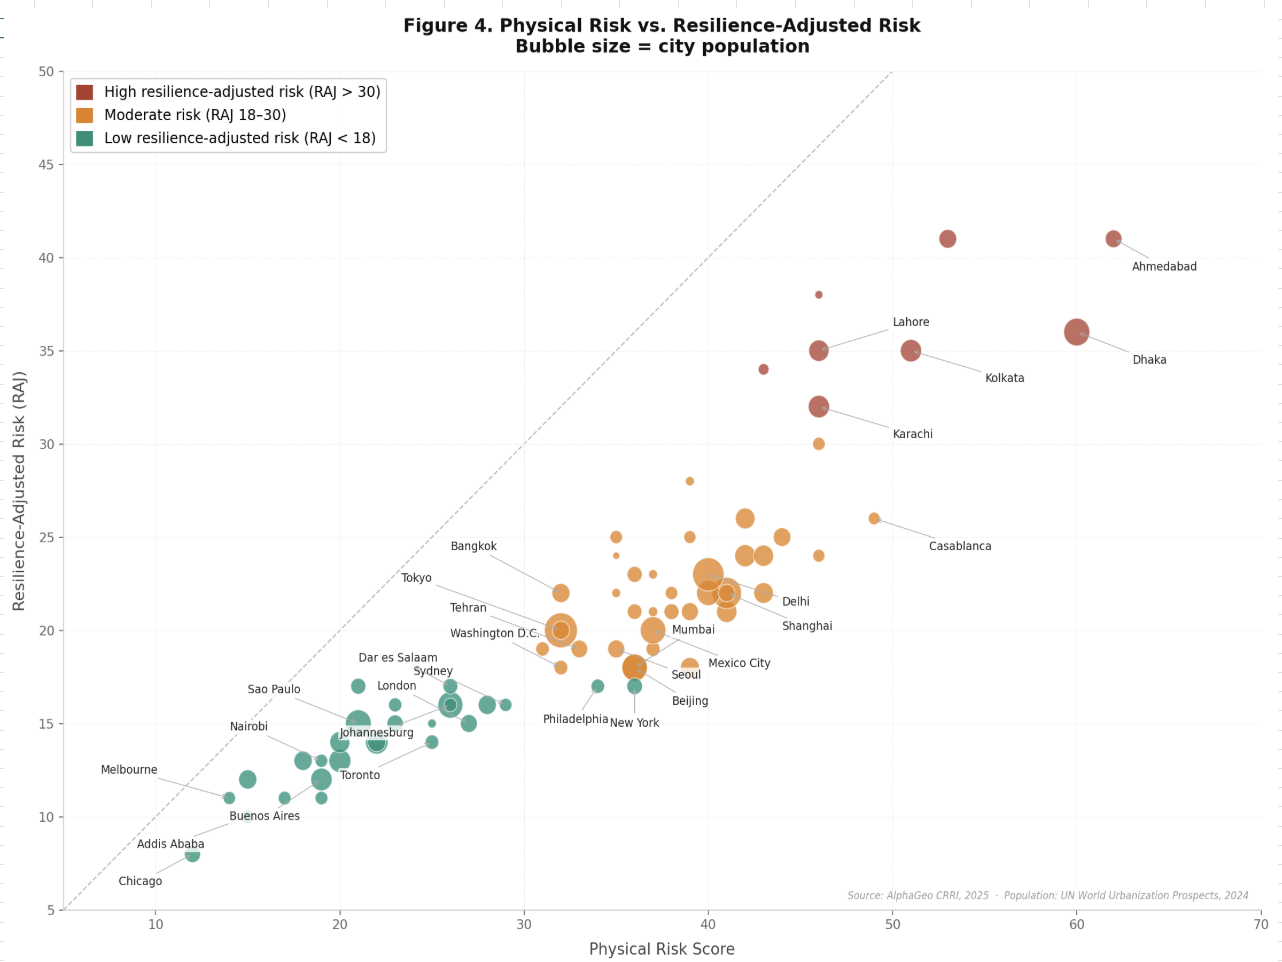
Three clusters emerge immediately. First, a group of European, African, and Latin American cities with both low physical risk and low RAJ scores — these cities benefit from both favorable geography and strong adaptation performance on the CRRI. Second, a dense middle cluster of Asian and Middle Eastern cities with moderate-to-high physical risk but varying degrees of adaptation performance. Third, a cluster of South Asian cities — particularly Ahmedabad, Hyderabad Pakistan, Kolkata, Lahore, and Dhaka — that combine extreme physical exposure with RAJ scores in the 32–41 range.
4. The Most Resilient Major Cities
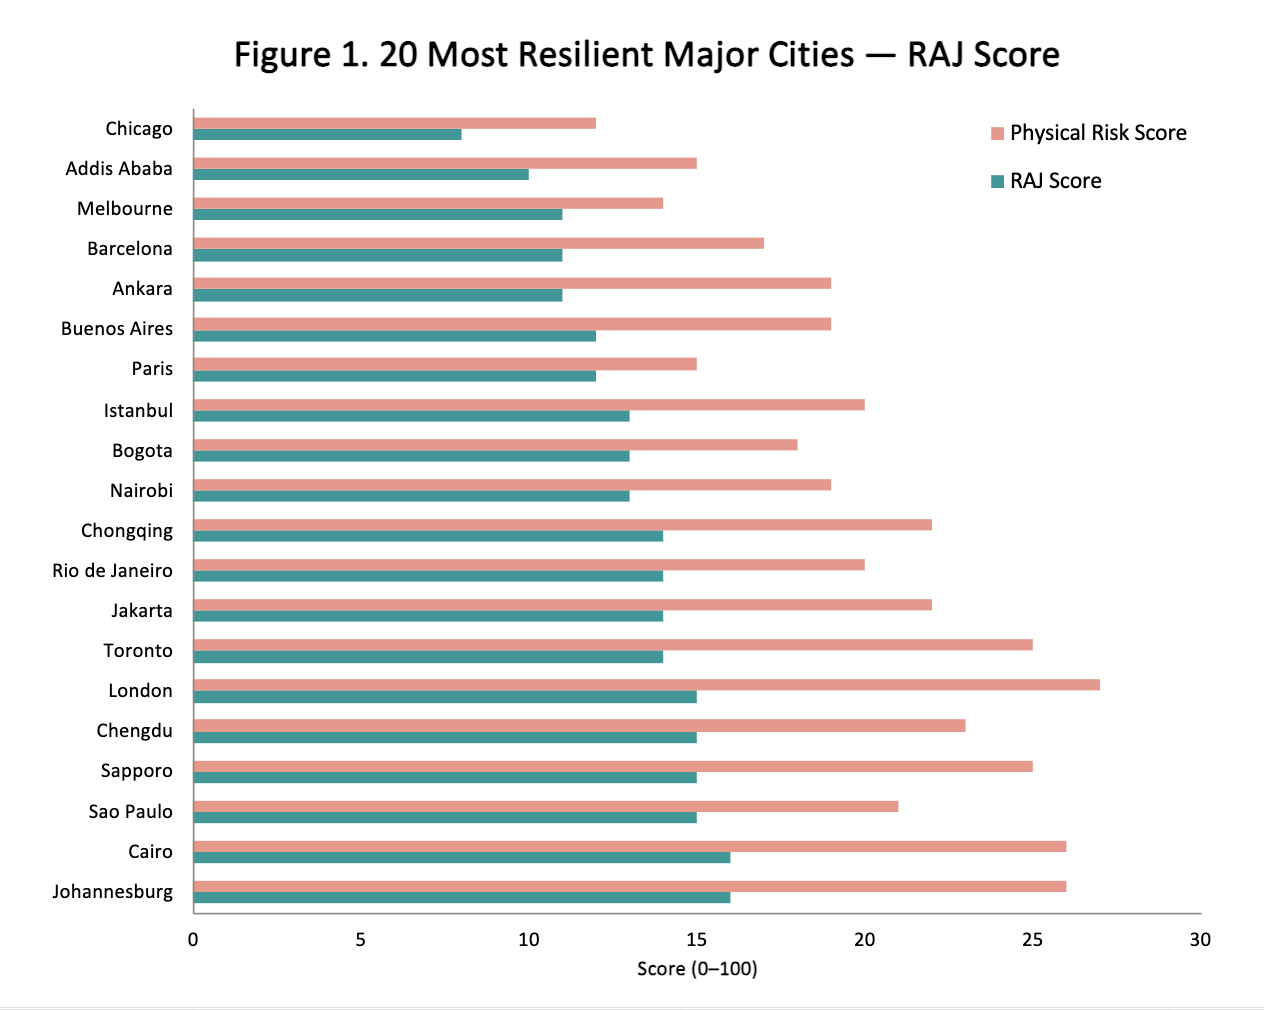
Resilience among the world’s largest cities is driven by 2 independent factors: low baseline physical exposure (primarily a function of geography and climate zone) and high adaptation investment (a function of governance, wealth, and policy). The cities at the top of this ranking benefit from both.
4.1 North American and European Leaders
Chicago (RAJ: 8) is the most resilient major city in this analysis, benefiting from low coastal and tropical hazard exposure combined with robust urban infrastructure. Barcelona (11), Paris (12), and London (15) represent European cities where temperate climate geography and decades of investment in flood defenses, heat action plans, and urban resilience frameworks produce consistently low residual risk. Madrid, despite carrying a higher physical risk score, shows one of the highest adaptation rates in the analysis — reflecting Spain’s National Adaptation Plan.
4.2 African Standouts
Addis Ababa (RAJ: 10), Nairobi (13), and Johannesburg (16) rank among the most resilient major cities globally. These cities benefit primarily from favorable elevation and climate geography — lower baseline hazard exposure on the key CRRI dimensions, combined with moderate adaptation performance. By RAJ score, all three outperform Bangkok, Jakarta, and every South Asian city in this analysis.
4.3 Latin American and Asia-Pacific Performers
Buenos Aires (RAJ: 12), Bogota (13), Rio de Janeiro (14), and Sao Paulo (15) rank among the most resilient major cities — a result consistent with relatively low baseline hazard exposure on the key CRRI dimensions. In the Asia-Pacific region, Melbourne (11) and Sydney (16) stand out, along with Jakarta (14) and Chongqing (14), which both carry physical risk scores of 22 and achieve RAJ scores of 14.
5. The Least Resilient Major Cities
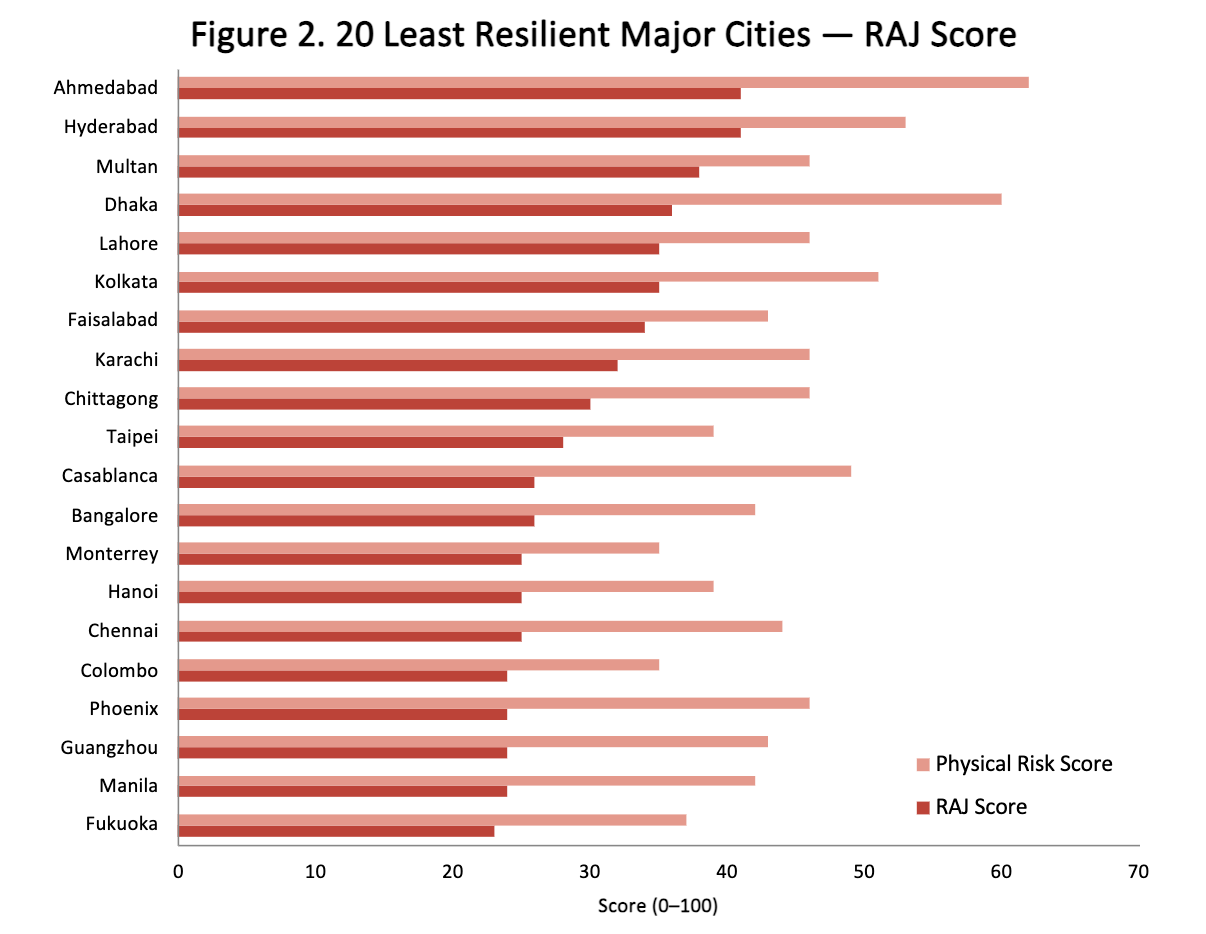
At the opposite end of the spectrum, a cluster of South Asian cities face extreme residual risk — indicating high exposure with limited adaptation impact.
5.1 South Asia: A Region Under Extreme Pressure
The 6 highest-risk major cities globally are all in South Asia: Ahmedabad (41), Hyderabad Pakistan (41), Multan (38), Dhaka (36), Kolkata (35), and Lahore (35), driven largely by heat exposure. These cities have adaptation rates that remain relatively low given the scale of physical risk.
Dhaka is the most physically exposed city in this analysis. With a physical risk score of 60, it carries the highest raw exposure of any major city in this dataset — and despite a meaningful adaptation delta of 24 points, the residual RAJ of 36 remains among the highest of any large city. For real asset investors, a RAJ score at this level warrants close scrutiny of exposure to property value deterioration, infrastructure lifespan, and operational continuity.
5.2 Japanese Megacities: High Risk, Strong Adaptation
Tokyo (RAJ: 20), Nagoya (20), Osaka (22), and Fukuoka (23) carry higher physical risk scores driven by heat exposure.
6. Adaptation Efficiency Leaders
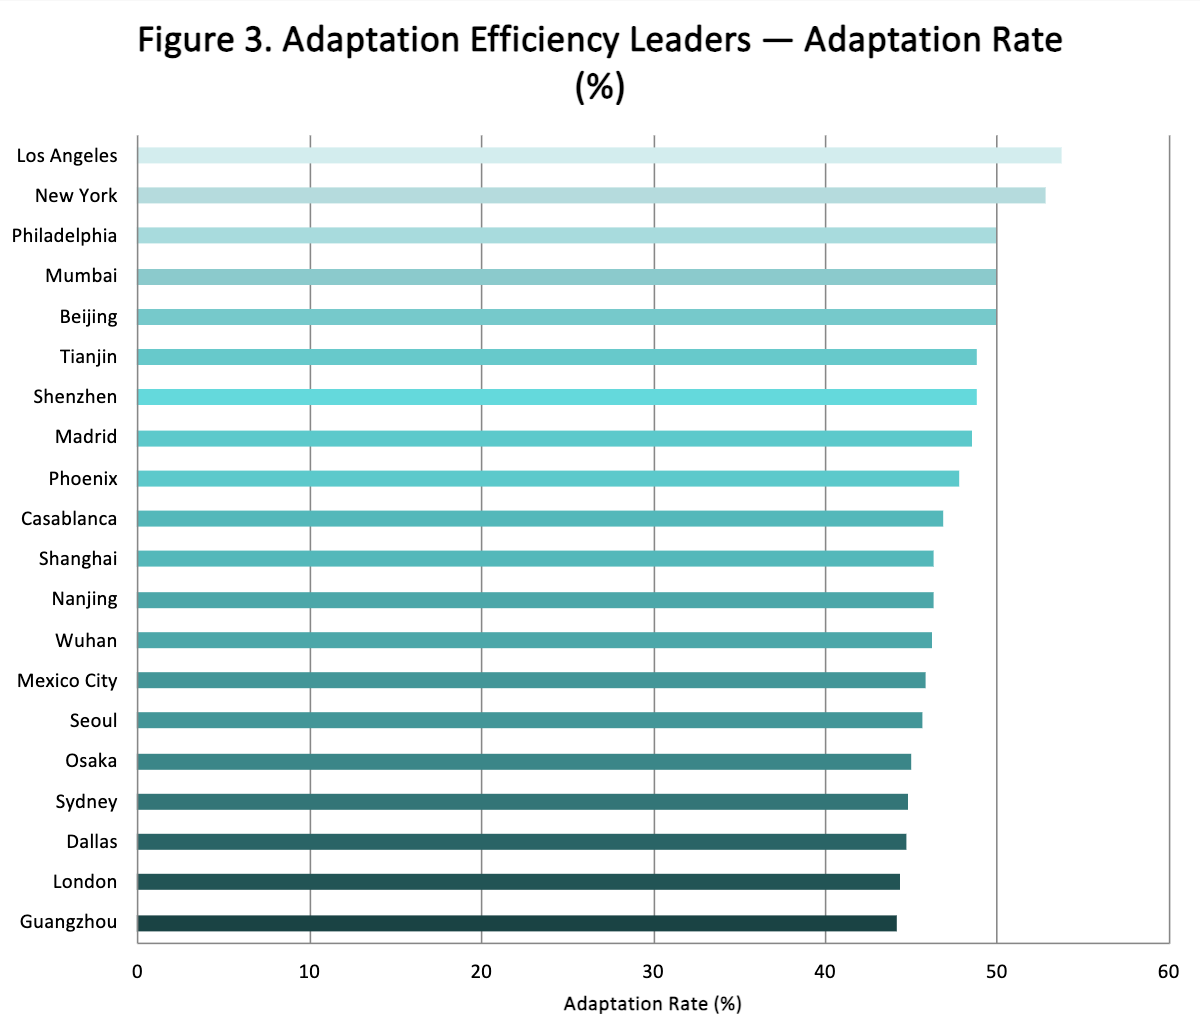
Adaptation rate measures the percentage of physical risk successfully offset by existing adaptation measures. This metric reveals which cities are generating the most resilience per unit of investment — and provides a practical benchmark for what is achievable.
6.1 The China Adaptation Story
One finding in this adaptation analysis is the consistency of Chinese megacities at the top of the efficiency rankings. Beijing (50%), Tianjin (49%), Shenzhen (49%), Shanghai (46%), Nanjing (46%), and Wuhan (46%) all achieve adaptation rates above 46% — a cluster of performance that stands out globally. It is worth noting that the CRRI reflects the measurable gap between physical risk and resilience-adjusted risk; investors should read this as a signal of relative positioning rather than a guarantee of protection.
6.2 Other Standout Performers
Madrid (49%) and Casablanca (47%) are 2 cities often overlooked in climate resilience discussions. Casablanca is a North African city with a high physical risk score of 49 while achieving a 23-point adaptation delta. Among major cities in middle-income economies, this places Casablanca in a notably strong position relative to its physical risk baseline. Los Angeles (54%) and New York (53%), Seoul (46%), Philadelphia (50%), and Washington D.C. (44%) round out the top adaptation performers.
7. Implications and Conclusion
Asset Owners and Managers
RAJ scores set a residual risk floor — the exposure that current adaptation cannot absorb. High-RAJ cities require underwriting that accounts for structural exposure. Cities with strong adaptation rates and improving RAJ trajectories — particularly East Asian and select MENA cities — represent relative resilience value where adaptation investment is compressing risk.
Sovereign and Municipal Bond Investors
Countries whose largest cities carry high RAJ scores without improving adaptation rates face growing contingent liabilities from disaster response, infrastructure repair, and population displacement. Bangladesh and Pakistan warrant particular attention given the combination of high urban RAJ scores and limited capacity to close the adaptation gap at the pace the physical risk profile demands.
Adaptation Consultants and Policymakers
The adaptation rate shows where infrastructure investment is producing measurable results and where the gap remains widest. For policymakers, the adaptation rate provides a standardized, trackable baseline for measuring whether adaptation spending is translating into reduced residual risk over time.
Regulatory Disclosure
TCFD, ISSB IFRS S2, and EU CSRD require portfolio-level physical risk disclosure. AlphaGeo’s three-metric framework maps directly — Risk Score (hazard identification), RAJ Score (risk assessment), Adaptation Delta (resilience evaluation) — supporting defensible, quantitative disclosure at the asset level.
Adaptation Finance and Development Institutions
Casablanca (47%), Guadalajara (42%), and Manila (43%) demonstrate that meaningful adaptation is achievable in emerging economies with targeted investment. The gap between these cities’ adaptation rates and peer cities in similar income brackets quantifies the adaptation finance opportunity. Directing concessional capital to cities with high physical risk and low adaptation rates — particularly in South Asia — represents the highest-impact deployment of adaptation finance globally.
Explore CRRI for your portfolio: Free trial
Explore our methodology: docs.alphageo.ai
Appendix: Full City List
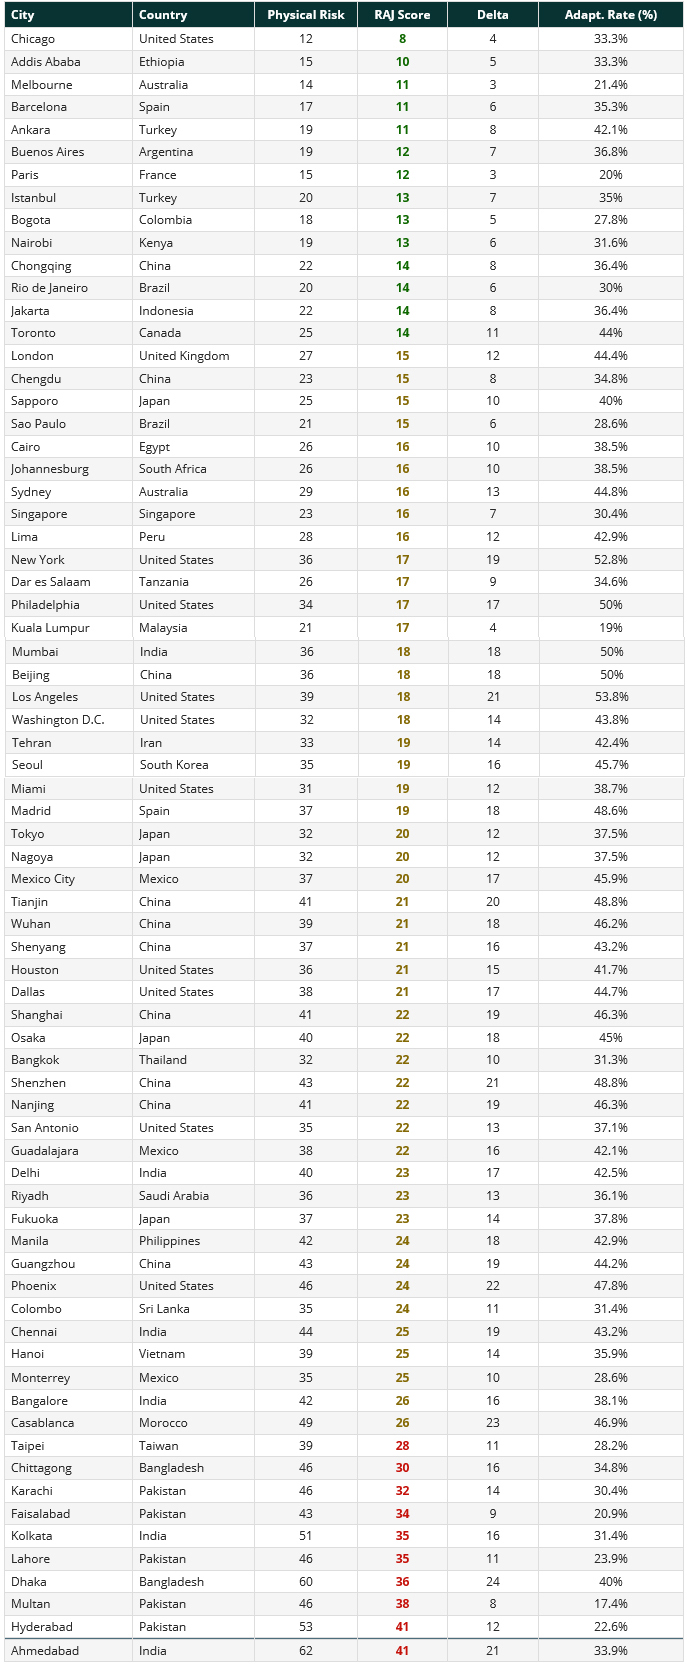
The table below ranks all 72 analyzed cities from most to least resilient by RAJ Score. Physical Risk, RAJ Score, Adaptation Delta, and Adaptation Rate are shown for each city. Green RAJ scores indicate low residual risk (≤ 15); amber indicates moderate (15–26); red indicates high (> 26).
About AlphaGeo & Legal Disclaimer
About AlphaGeo
AlphaGeo is a climate intelligence company providing location-level physical risk and adaptation data to institutional investors, infrastructure owners, and policymakers globally. The Climate Risk & Resilience Index (CRRI) is AlphaGeo’s flagship product, covering assets and cities globally with annual updates.
For access to city-level and asset-level data, portfolio screening tools, and custom analysis, visit alphageo.ai or contact the AlphaGeo team directly.
Legal Disclaimer
This report is provided for informational purposes only and is not for redistribution, resale, or sublicensing. AlphaGeo analytics are intended for internal decision support and may be shared with clients but not commercialized without AlphaGeo’s prior written consent. The scores and analyses contained herein are derived from AlphaGeo’s proprietary Climate Risk & Resilience Index (CRRI) and reflect data as of 2025. (Source: AlphaGeo, 2025)