Since the end of 2022, American households have become $52 trillion richer. The top 1 percent took 40 percent of that. The bottom half of the country, about 68 million households, took 1.6 percent. The Federal Reserve’s own data show a system that turns asset prices into private fortunes, while more than a third of adults wouldn’t be able to pay a surprise $400 bill in cash.
Res.Publica, November 20, 2026.
Key points
- US household net worth rose by $51.5 trillion between the end of 2022 and mid-2026. The top 1% gained $20.5 trillion, the bottom 50% gained $0.8 trillion.
- The top 1% now holds 32.5% of all household wealth, the highest share since the Fed’s records began in 1989. The bottom half holds 2.3%, less than in 1989.
- The top 1% owns 50.9% of all stocks and mutual fund shares held by households. The bottom half owns 0.6%.
- 37% of American adults wouldn’t pay a surprise $400 expense with cash or its equivalent. Half of all renter households spend more than 30% of their income on housing.
The number went around this week after Steve Rattner put it on MSNBC: $52 trillion in new wealth, 2 percent for the bottom half. We checked it against the Federal Reserve’s Distributional Financial Accounts, the official breakdown of household wealth by wealth group. The chart is right. If anything, it rounds up: the precise share for the bottom half is 1.6 percent.
But the more important story isn’t one chart. It’s what the official data show about where American wealth goes, why it goes there, and what that means for the people who don’t get any of it.
Where the $52 trillion went
The Fed splits all household wealth into four groups: the richest 1%, the next 9%, the next 40% and the bottom 50%. Between the fourth quarter of 2022 and the second quarter of 2026, the latest data available, their net worth changed like this:
- Top 1%: from $39.9 trillion to $60.3 trillion. Plus $20.5 trillion, or 39.7% of all new wealth.
- Next 9%: from $49.0 trillion to $67.6 trillion. Plus $18.7 trillion, or 36.2%.
- Next 40%: from $41.8 trillion to $53.4 trillion. Plus $11.6 trillion, or 22.5%.
- Bottom 50%: from $3.5 trillion to $4.3 trillion. Plus $0.8 trillion, or 1.6%.
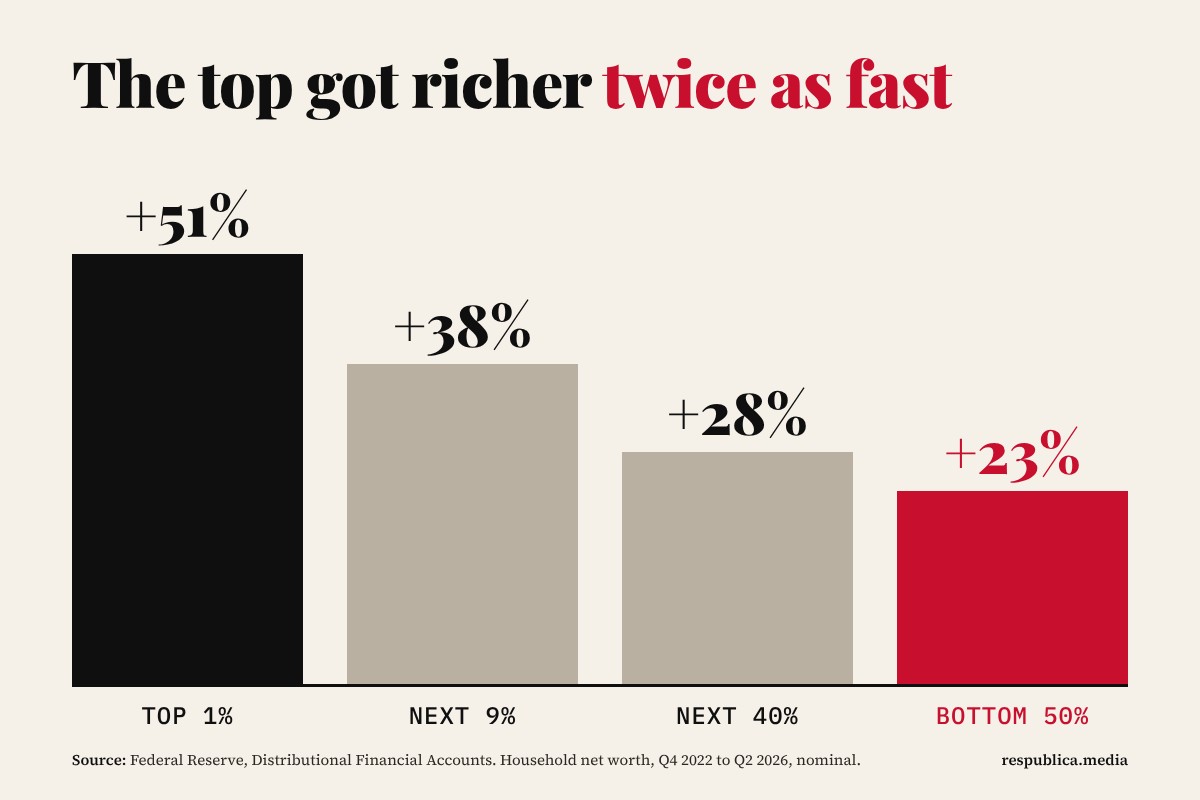
Measured in growth rates, the top 1% got 51% richer, the bottom half 23%. Adjusted for inflation, which ran at roughly 11% over the period according to the Bureau of Labor Statistics, the gap gets wider: about 36% real growth at the top, about 10% at the bottom.
The start date matters. The end of 2022 came right after a stock market slump, so this period catches the full rebound. But the trend doesn’t depend on picking a good quarter.
Thirty-five years in one direction
The Fed’s series goes back to 1989. In the third quarter of that year, the top 1% held 22.8% of all household wealth. Today it’s 32.5%. The bottom half held 3.5% in 1989. Today it holds 2.3%.
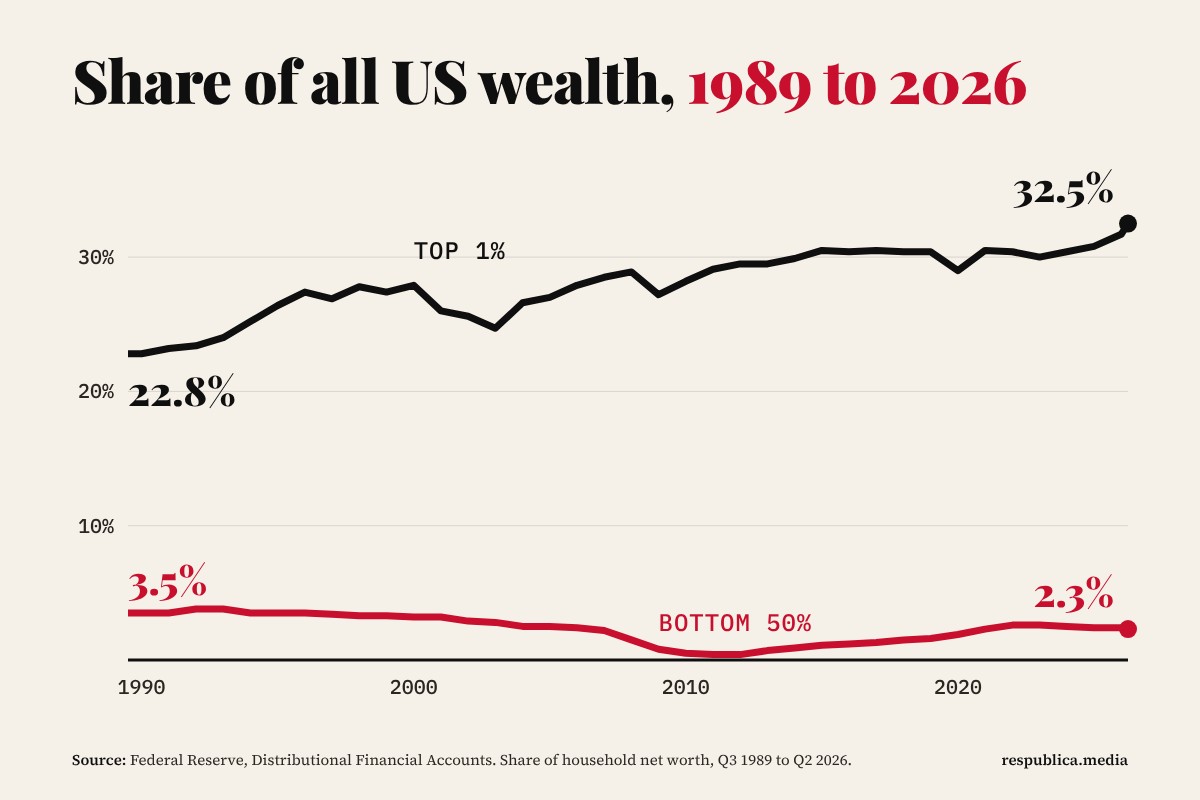
In dollars, the top 1%’s wealth went from $4.7 trillion to $60.3 trillion, almost thirteen times as much. The bottom half went from $0.7 trillion to $4.3 trillion, six times as much, before inflation.
The worst moment for the bottom half came after the 2008 financial crisis. Its share of all wealth fell from 2.2% in early 2007 to 0.4% in 2011 and 2012. Millions lost their homes in foreclosure, and with them the only real asset they had. It took until 2021 for the bottom half’s share to get back to where it was before the crisis. The top 1% lost ground for a year and then kept climbing.
Why the gains go to the top
The answer is in what each group owns. In the US, wealth grows mainly through asset prices: stocks, private businesses, real estate. And those assets are extremely concentrated.
The top 1% owns 50.9% of all corporate equities and mutual fund shares held by households. The bottom half owns 0.6%. According to the Fed’s Survey of Consumer Finances, 56% of American families own any stock at all, including through retirement accounts, down from 58% in 2022. When the stock market rises, almost half the country simply isn’t in it.
For the bottom half, wealth is a house or a car, set against a mortgage, car loans, student debt and credit cards. Between the end of 2022 and mid-2026, the bottom half’s assets rose by $1.2 trillion and its debts by $0.4 trillion. Its share of all household real estate fell from 11.1% to 9.7%.
Meanwhile, the share of the economy that goes to work keeps shrinking. According to the Bureau of Labor Statistics, the labor share of output in the nonfarm business sector fell to 53.0% in the third quarter of 2026, the lowest level since records began in 1947. Less of what the economy produces goes to the people who work. More goes to those who own.
A tax code that rewards owning over working
The concentration isn’t just a market outcome. US tax law treats income from owning differently from income from working.
- Work: wages are taxed at up to 37% federal income tax in 2026, plus payroll taxes for Social Security and Medicare.
- Owning: long-term capital gains and qualified dividends are taxed at 0%, 15% or 20%, plus a 3.8% net investment income tax at higher incomes. The top rate is 23.8%.
- Not selling: gains that are never sold are never taxed. Wealthy households can borrow against rising stock portfolios instead of selling them.
- Inheriting: under the “stepped-up basis” rule, heirs take over assets at their market value on the day of death. Every gain made during the owner’s lifetime is never taxed as income.
Put together, the largest fortunes in the country grow in a space where income tax barely reaches them. A nurse in the 24% tax bracket pays more than 31% on each extra dollar of overtime, including payroll taxes. A wealthy shareholder pays at most 23.8% on a stock gain.
What it means for people
The wealth figures are abstract. The consequences are not. The Federal Reserve’s annual survey of household finances, published in May 2026, shows what life looks like for those who don’t own much:
- Only 63% of adults would cover an unexpected $400 expense with cash or its equivalent. That figure hasn’t improved in three years and is down from 68% in 2021.
- 16% did not pay all their bills in full in the month before the survey.
- 26% went without some medical care in the past year because they couldn’t afford it.
- 23% of renters fell behind on rent at some point during the year.
- Only 35% of adults who aren’t retired think their retirement savings are on track.
Housing. According to Harvard’s Joint Center for Housing Studies, 22.7 million renter households, 49% of all renters, spend more than 30% of their income on housing, a record. 12.1 million spend more than half. The median home now costs 4.7 times the median household income. For people without property, buying in has rarely been harder, and that locks them out of the one asset that has built wealth for the American middle class.
Debt. Household debt reached $19.1 trillion in the third quarter of 2026, according to the New York Fed. Credit card balances stand at $1.29 trillion. 10.9% of student loan balances are 90 or more days delinquent.
The bottom keeps falling. The Fed’s Survey of Consumer Finances 2025 shows the gap inside the population even more starkly. The median net worth of the poorest quarter of families fell from $3,800 in 2022 to $1,700 in 2025, a drop of 56%. The median for the richest tenth rose 19%, to $4.9 million.
Health and life. Money buys time. A study by Raj Chetty and colleagues in the Journal of the American Medical Association found that among Americans aged 40, the richest 1% of men live 14.6 years longer than the poorest 1%. For women, the gap is 10.1 years.
The top 1% owns half of all stocks. The bottom half owns 0.6 percent. In an economy that grows through asset prices, that difference decides who gets richer.
The paradox: incomes up, security down
Not every number points down. According to the Census Bureau, real median household income reached $87,460 in 2025, the highest on record. The official poverty rate fell to 10.2%. Most Americans say they’re doing at least okay financially.
That fits with everything above. Incomes can rise while wealth concentrates, because wealth growth comes from owning, not from earning. A household can earn more than ever and still have no savings, no house and no stake in the stock market that is producing most of the new money. Income pays the bills. Wealth is what protects you when something goes wrong, pays for a down payment, funds a business or gets passed on to your children. That’s the part half the country barely has.
Our view
None of this is a natural law. It’s the result of choices: a tax code that taxes work more heavily than wealth, a housing market that has priced out new buyers, a financial system in which gains are private and, as in 2008, losses fall hardest on those with the least.
The US has created $52 trillion in new household wealth in three and a half years. That it went overwhelmingly to people who were already rich isn’t an accident of the stock market. It’s how the system is built. An economy where half the population owns 2.3% of the wealth, and where more than a third of adults wouldn’t pay a surprise $400 bill in cash, isn’t just unequal. It’s fragile. A system that rewards ownership needs to make sure more people can own something. Right now, the US is moving the other way.
Sources
- Federal Reserve, Distributional Financial Accounts, release of September 18, 2026: https://www.federalreserve.gov/releases/z1/dataviz/dfa/distribute/table/
- FRED, net worth held by the top 1% (WFRBLT01026): https://fred.stlouisfed.org/series/WFRBLT01026
- FRED, net worth held by the 90th to 99th wealth percentiles (WFRBLN09053): https://fred.stlouisfed.org/series/WFRBLN09053
- FRED, net worth held by the 50th to 90th wealth percentiles (WFRBLN40080): https://fred.stlouisfed.org/series/WFRBLN40080
- FRED, net worth held by the bottom 50% (WFRBLB50107): https://fred.stlouisfed.org/series/WFRBLB50107
- FRED, share of net worth held by the top 1% (WFRBST01134): https://fred.stlouisfed.org/series/WFRBST01134
- FRED, share of net worth held by the bottom 50% (WFRBSB50215): https://fred.stlouisfed.org/series/WFRBSB50215
- FRED, share of corporate equities and mutual fund shares held by the top 1% (WFRBST01122): https://fred.stlouisfed.org/series/WFRBST01122
- FRED, share of corporate equities and mutual fund shares held by the bottom 50% (WFRBSB50203): https://fred.stlouisfed.org/series/WFRBSB50203
- FRED, total assets held by the bottom 50% (WFRBLB50081): https://fred.stlouisfed.org/series/WFRBLB50081
- FRED, total liabilities held by the bottom 50% (WFRBLB50100): https://fred.stlouisfed.org/series/WFRBLB50100
- FRED, share of real estate held by the bottom 50% (WFRBSB50191): https://fred.stlouisfed.org/series/WFRBSB50191
- FRED, Consumer Price Index for All Urban Consumers (CPIAUCSL), Bureau of Labor Statistics: https://fred.stlouisfed.org/series/CPIAUCSL
- Federal Reserve, Economic Well-Being of U.S. Households in 2025, May 2026: https://www.federalreserve.gov/publications/2026-economic-well-being-of-us-households-in-2025-executive-summary.htm
- Federal Reserve, Survey of Consumer Finances 2025: https://www.federalreserve.gov/publications/files/scf26.pdf
- Harvard Joint Center for Housing Studies, State of the Nation’s Housing 2026, Key Facts: https://www.jchs.harvard.edu/sites/default/files/interactive-item/files/Harvard_JCHS_State_Nations_Housing_2026_Key_Facts_0.pdf
- Federal Reserve Bank of New York, Household Debt and Credit Report Q3 2026: https://www.newyorkfed.org/newsevents/news/research/2026/20261110
- Bureau of Labor Statistics, Productivity and Costs, Q3 2026: https://www.bls.gov/news.release/prod2.htm
- Census Bureau, Income, Poverty and Health Insurance Coverage 2025: https://www.census.gov/newsroom/press-releases/2026/income-poverty-health-insurance-coverage.html
- IRS, Rev. Proc. 2025-32, 2026 tax rates and thresholds: https://www.irs.gov/irb/2025-45_IRB
- IRS, Topic 559, Net investment income tax: https://www.irs.gov/taxtopics/tc559
- IRS, Publication 551, Basis of Assets: https://www.irs.gov/publications/p551
- Chetty et al., The Association Between Income and Life Expectancy in the United States, 2001-2014, JAMA 2016: https://pmc.ncbi.nlm.nih.gov/articles/PMC4866586/