Plenty of countries were always richer than Japan. These six started far behind: Lithuania and Poland produced about a third as much per person in 1995. By 2024 five were level or ahead and Poland was at 95%. Japan never stopped growing per worker; it ran out of workers.

Alex·CrossBorders
Updated October 2026·6 min read
Writing about this? Charts, data and findings you can quote.
In 1995 the average Lithuanian produced about a third as much as the average Japanese. Poland was at 37%. By 2024 Lithuania had drawn level and Poland had reached 95%. Malta, South Korea, Slovenia and Czechia were already ahead.
Five of the six joined the European Union on the same day, 1 May 2004, and spent the next twenty years plugging into its markets, its supply chains and its funds. South Korea took the other road, exporting its way up from a country that joined the OECD only in 1996.
It looks like the rise of the new Europe and the fall of Japan. Only the first half is true.
MaltaSouth KoreaSloveniaCzechiaLithuaniaPoland
Data: World Bank, World Development Indicators (CC BY 4.0). GDP per capita at purchasing power parity, constant 2021 dollars. Japan = 100 every year. Hover or tap for any year.
Use this chart in your article: chart image, data (CSV), how to credit.
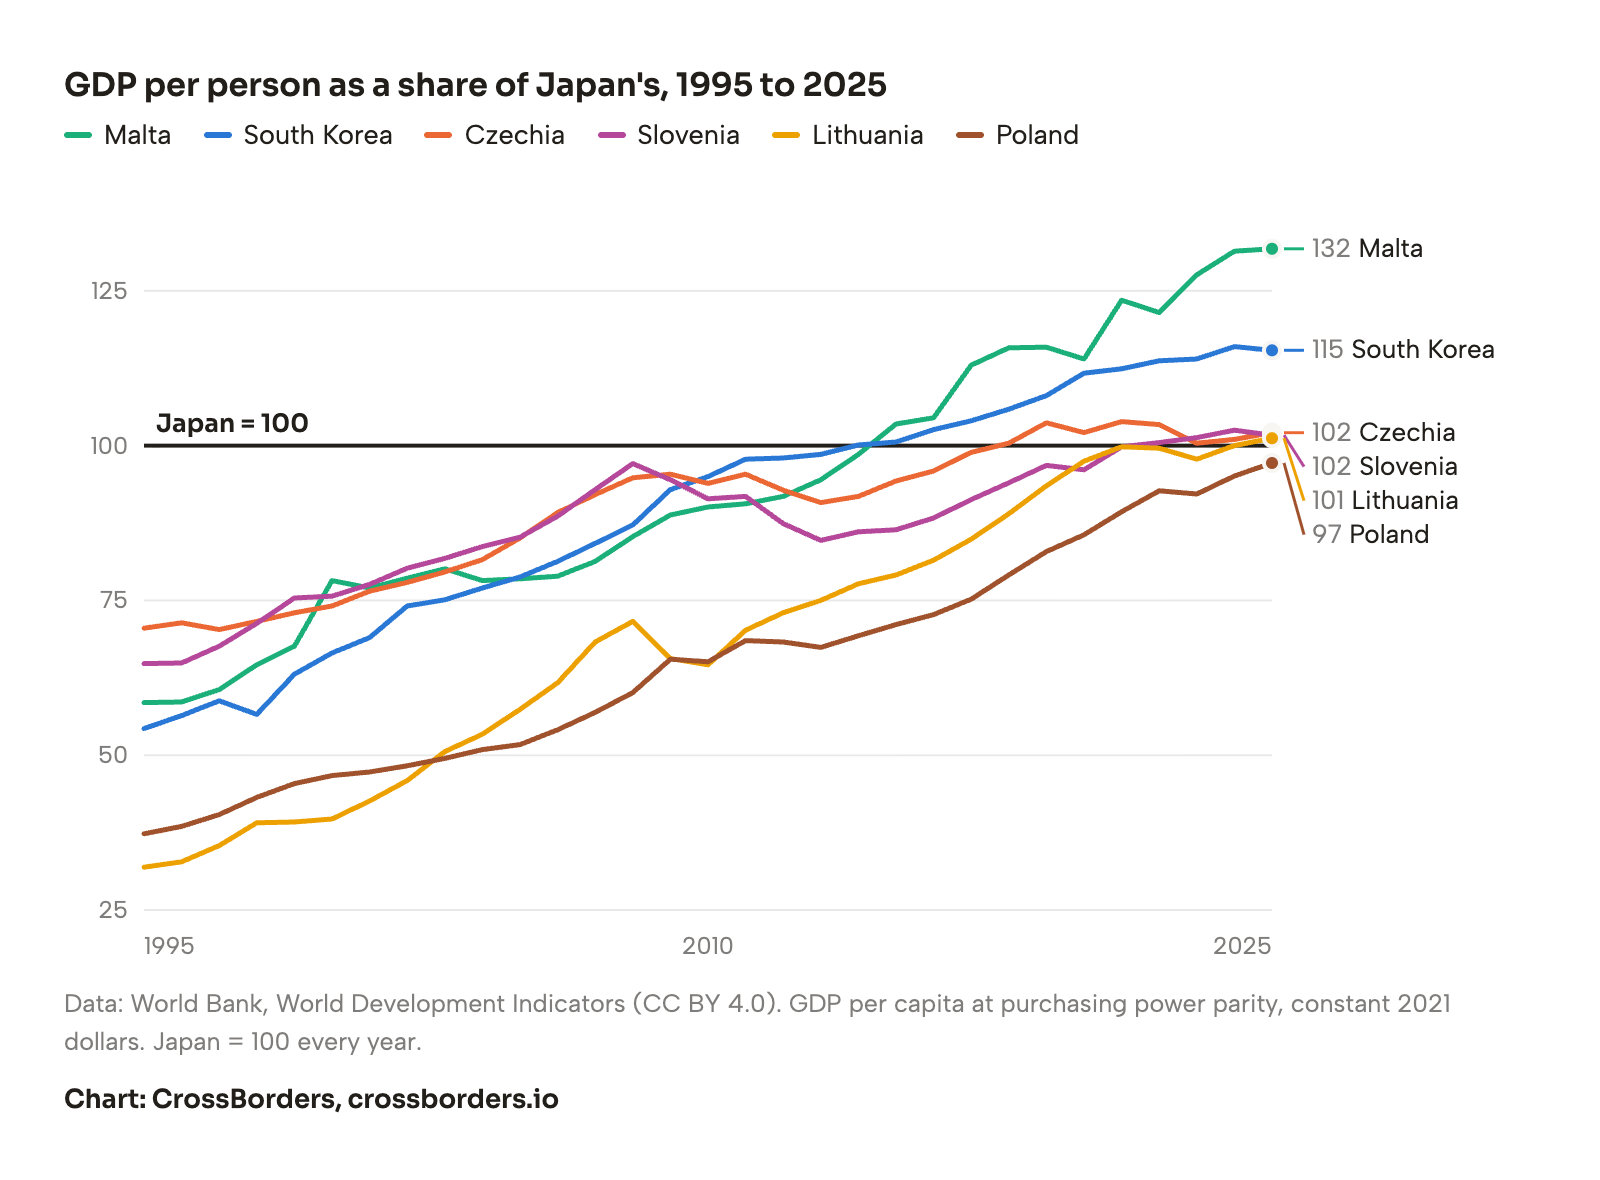
The six are chosen by a fixed rule: every economy below 75% of Japan's GDP per person in 1995 and at least 95% in 2024. Guyana also qualifies (19% to 149%), on an oil boom, and is left out.
Japan didn't stop growing. It ran out of workers.
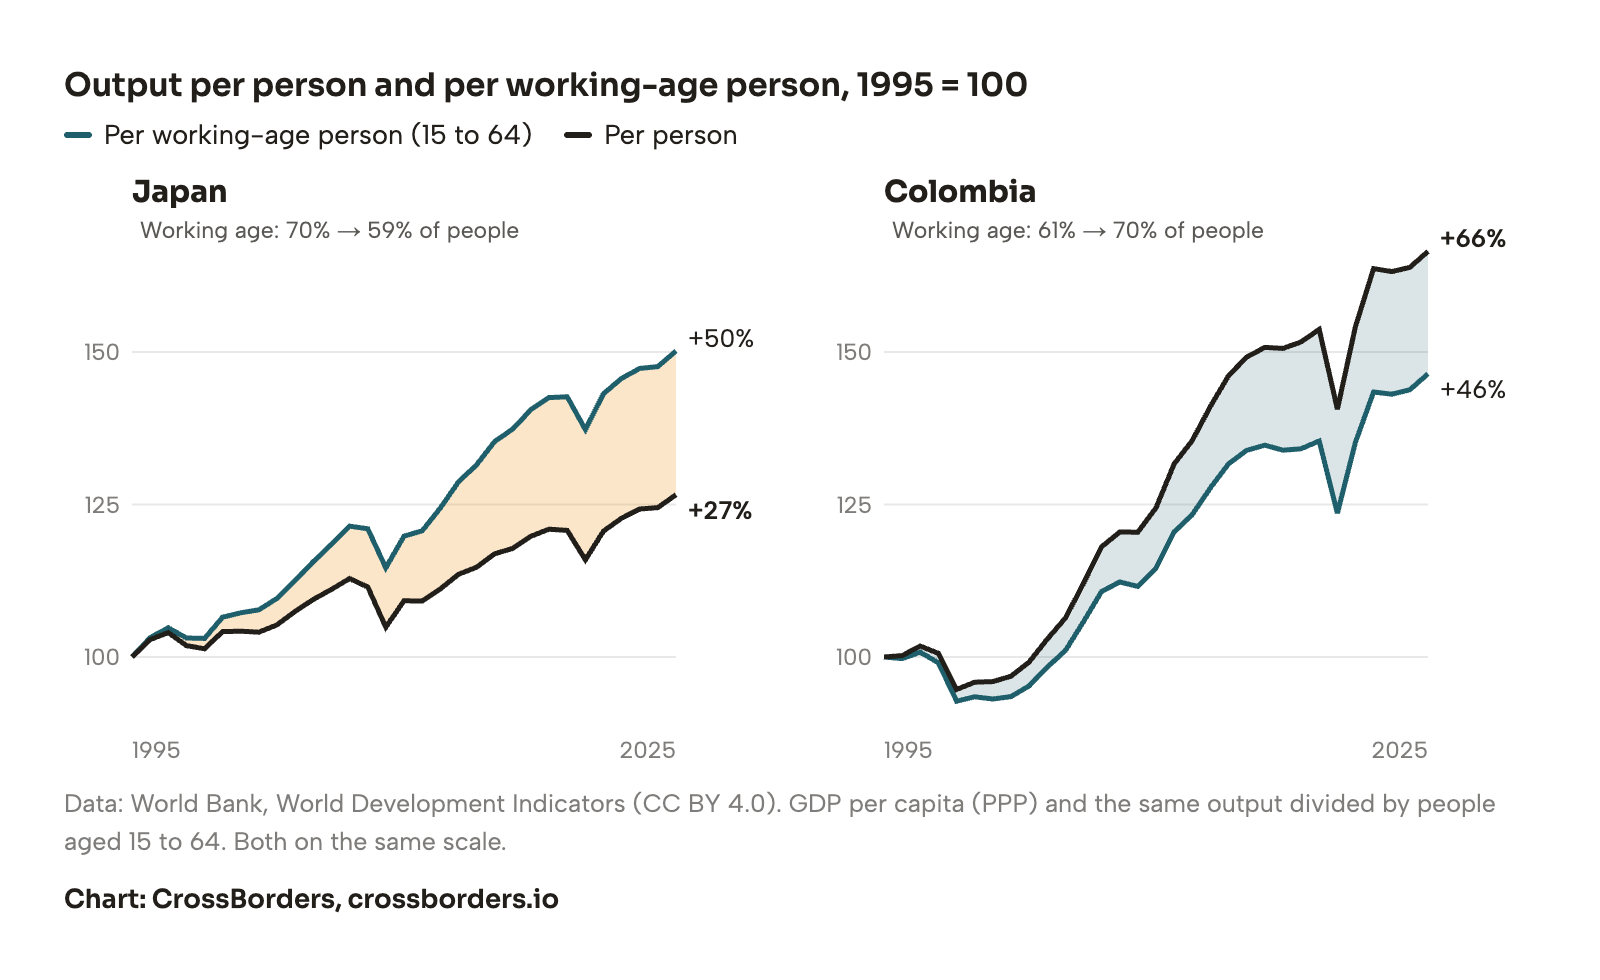
Japan's GDP per person grew 24% in those 30 years, the second slowest of all 38 OECD members after Italy. Measured per person of working age, it grew 48%, as fast as Germany (49%).
The difference is who is working. In 1995, 70% of Japanese were aged 15 to 64. Today 59% are. Each worker carries more people, so output per head lags output per worker. Colombia is the mirror image: about the same growth per worker, but a population getting younger, so its output per person rose 64%.
Per working-age person (15 to 64)Per person
Data: World Bank, World Development Indicators (CC BY 4.0). GDP per capita (PPP) and the same output divided by people aged 15 to 64. Both on the same scale.
Use this chart in your article: chart image, data (CSV), how to credit.
Anyone who has spent a week in Japan has seen this without a single chart. The taxi driver in white gloves is often older than your parents. So is the man in the hard hat waving cars past a building site. More than half of Japanese aged 65 to 69 still have a job, and since 2021 employers have been legally asked to try to keep their staff on until 70.
Japan didn't stop working. It has fewer young people to do the work, and it has started, quietly, to bring them in: a record 3.77 million foreign residents lived in Japan at the end of 2024, about 3% of the population and still small by European standards.
Take the ageing away, and only Malta is ahead
Japan's ageing is no accident of one bad decade. Its birth rate has been low for two generations: in 2024 it fell to 1.15 children per woman, and fewer than 690,000 babies were born, the fewest on record. Outside the big cities you can see where that leads. The 2023 housing survey counted 9 million empty homes, one in seven, many of them inherited by children who live somewhere else.
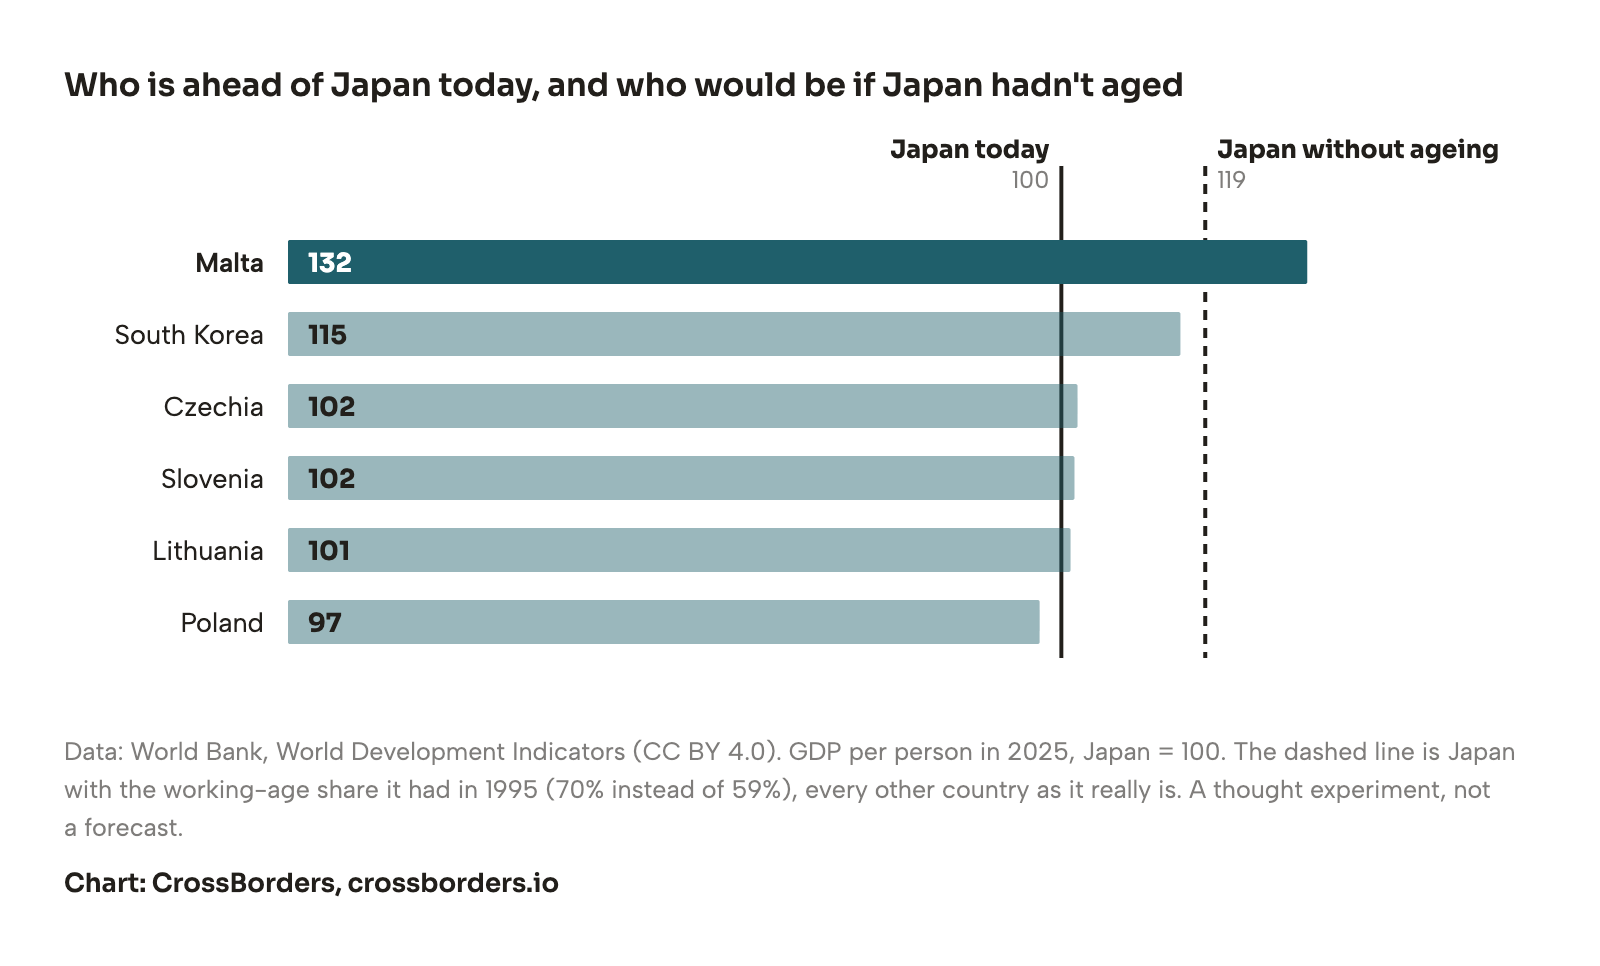
Had Japan kept its 1995 share of working-age people, its output per person would be about 19% higher today. Put that Japan next to the six, and only Malta clears it. South Korea comes close; the rest are well short.
Data: World Bank, World Development Indicators (CC BY 4.0). GDP per person in 2024, Japan = 100. The dashed line is Japan with the working-age share it had in 1995 (70% instead of 59%), every other country as it really is. A thought experiment, not a forecast.
Use this chart in your article: chart image, data (CSV), how to credit.
None of that makes the catch-up an illusion. Poland's output per person grew about 3.2 times over in 30 years, Lithuania's nearly 4 times. That is real growth by any measure. It just met a rival that was getting more productive while its workforce shrank.
The catch-up generation is ageing too
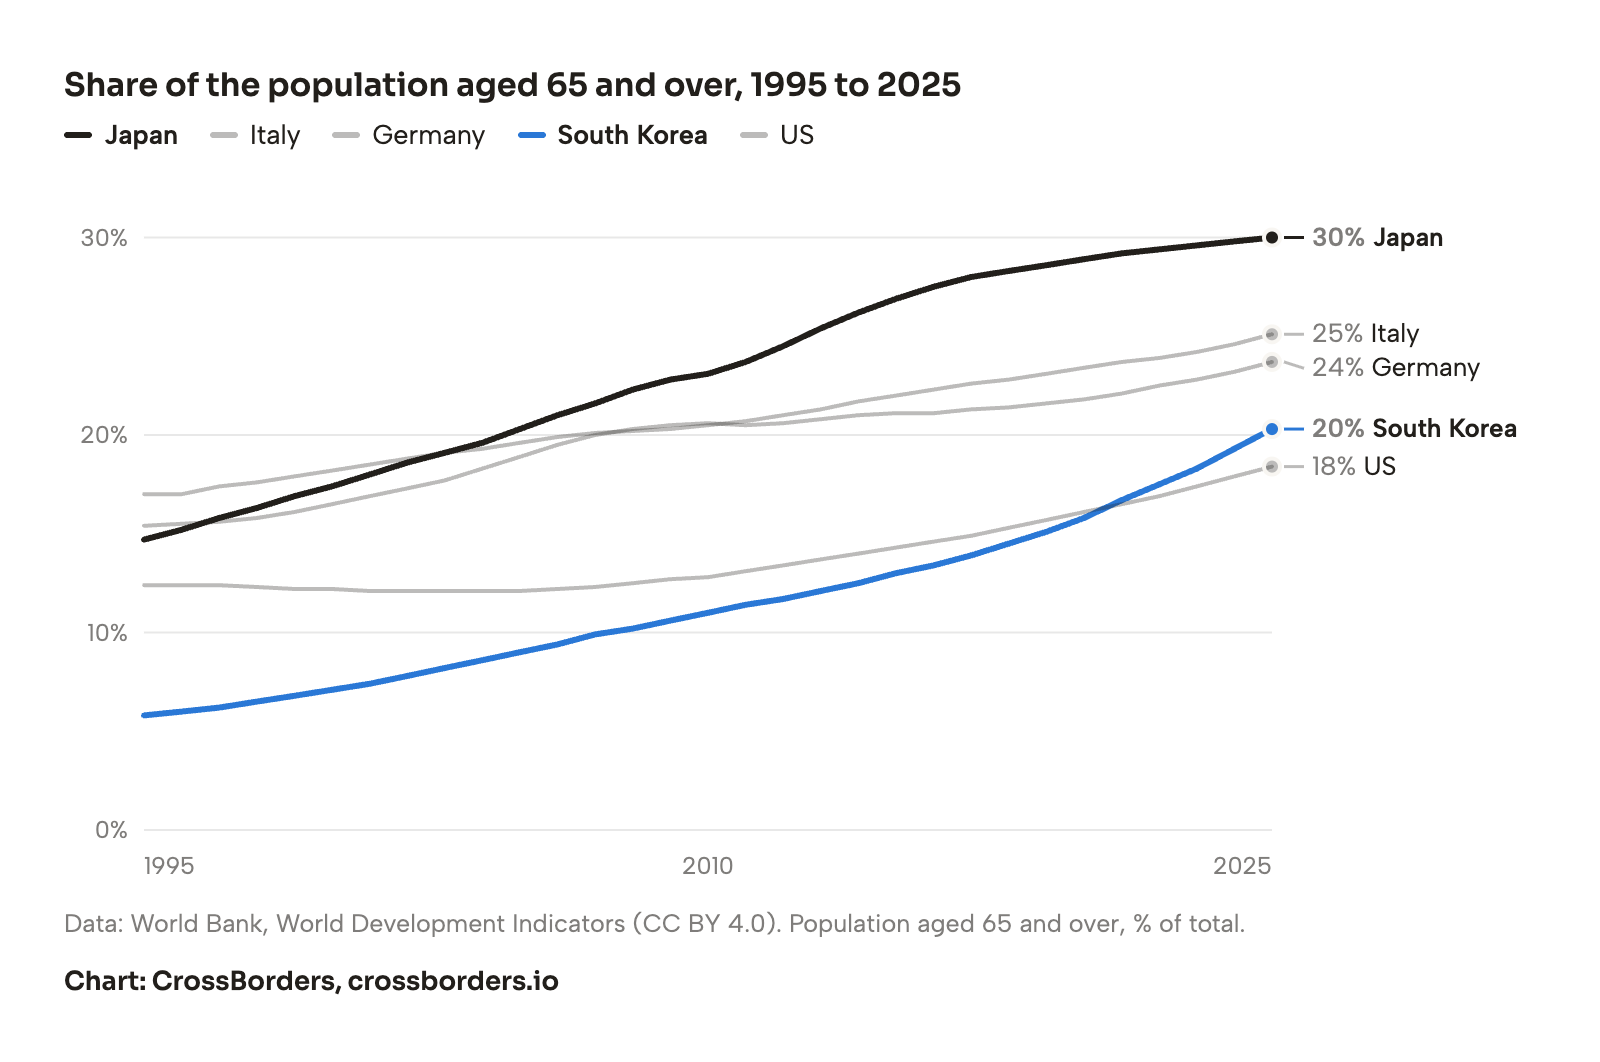
The share of Japanese aged 65 and over doubled, from 15% to 30%. South Korea started far younger, at 6%, and has more than tripled to 19%, faster than any other country here. The arithmetic that flattered the catch-up is coming for Korea next. Its fertility rate was 0.75 in 2024, the lowest of any country; Japan's, at 1.15, looks generous next to it.
The European six have their own version. Lithuania had 3.7 million people when it regained independence and about 2.8 million today, a loss of roughly a quarter, mostly to emigration, much of it young people heading west once the EU opened up. Catching up with Japan's output and avoiding Japan's demographics are two different races.
JapanItalyGermanySouth KoreaUS
Data: World Bank, World Development Indicators (CC BY 4.0). Population aged 65 and over, % of total. Hover or tap for any year.
Use this chart in your article: chart image, data (CSV), how to credit.
Not just six lucky countries
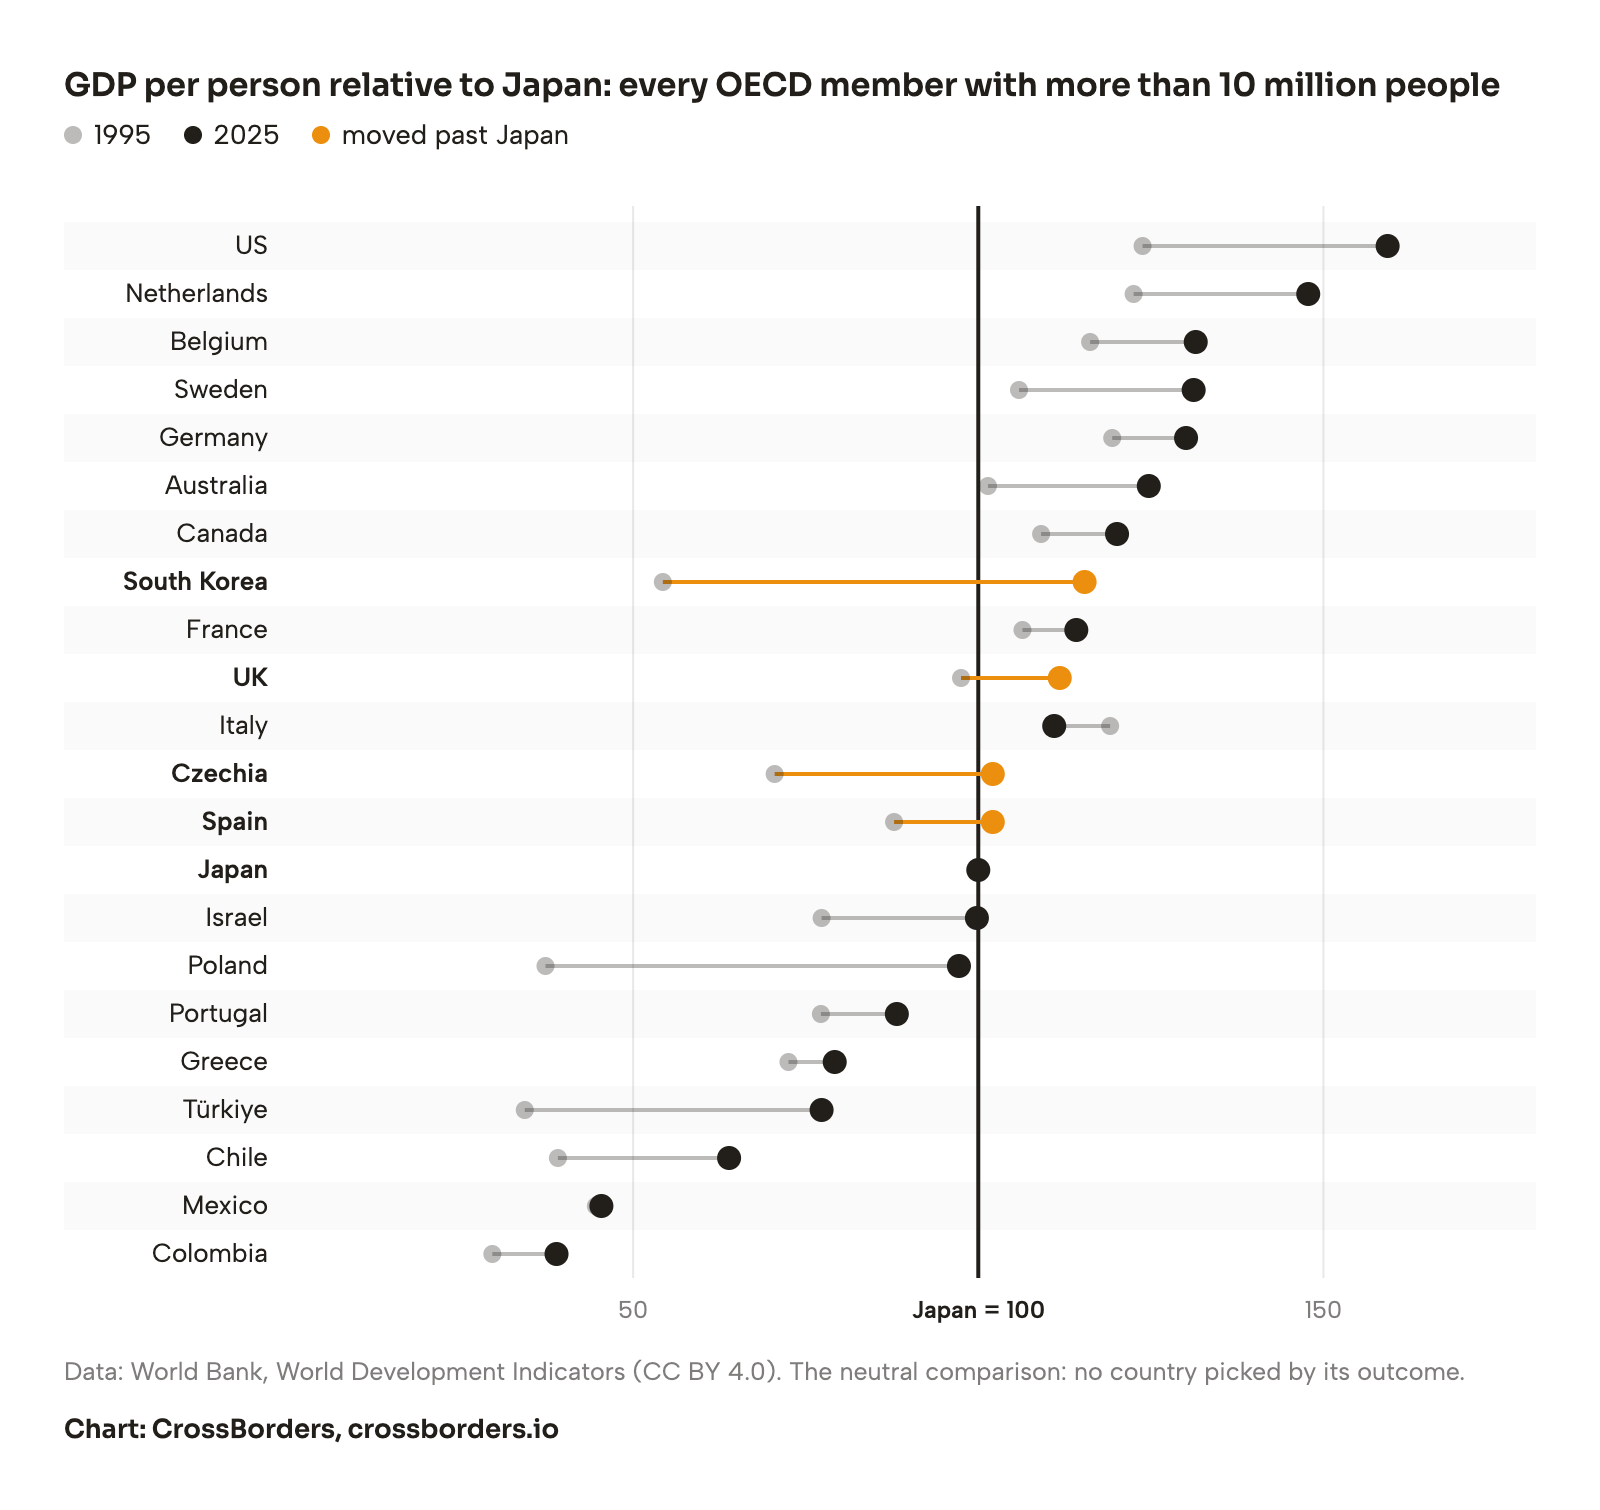
Picking countries because they caught up flatters the story, so here is every OECD member with more than 10 million people. South Korea, UK, Spain and Czechia moved past Japan. Nearly everyone closed part of the gap. Italy is the only one that fell further behind.
19952024moved past Japan
Data: World Bank, World Development Indicators (CC BY 4.0). The neutral comparison: no country picked by its outcome. Hover or tap a row.
Use this chart in your article: chart image, data (CSV), how to credit.
Richer on paper. Renting alone still hurts.
If you are thinking of moving to one of these cities, output per person is the wrong number. What matters is what a flat costs against what people there earn.
A one-bedroom takes 37 to 44% of an average local salary in the Polish, Czech and Lithuanian cities, and 53% in Sliema. The usual rule of thumb is 30%. Only Busan and Seoul come in under it. Tokyo is no escape either: a one-bedroom there takes 41% of average Tokyo pay.
Asking rent for a one-bedroom against average net pay in the same city; hover or tap a city for the amounts. Pay is the mean, so a typical worker spends more. Sources for every city.
The rent has caught up. The pay hasn't.
A one-bedroom costs $974 a month in Warsaw and $1,003 in Prague, against $866 in Tokyo and $979 in Berlin. But that flat takes 44% of an average salary in Warsaw and 44% in Prague, against 32% in Berlin. The flats are priced like the rich world now; local salaries are still on their way there.
Could you live in one of them?
For reportersCharts, data, credit line and findings you can quote
Use these charts in your article, no need to ask. Please link to this story as the source. In print, credit CrossBorders. The charts and data are licensed CC BY 4.0.
Download all charts and data (.zip)
How to credit
Source: CrossBorders, "Poland is almost as rich as Japan now", October 2026, using World Bank data (CC BY 4.0). https://crossborders.io/insights/countries-that-caught-up-with-japan
Findings you can quote
- Poland's GDP per person rose from 37% of Japan's in 1995 to 95% in 2024, at purchasing power parity.
- Lithuania went from 32% of Japan's GDP per person to 100% over the same period. Malta, South Korea, Slovenia and Czechia moved ahead of Japan.
- Japan's GDP per person grew 24% from 1995 to 2024, the second slowest of all 38 OECD members after Italy.
- Measured per person of working age, Japan's output grew 48%, against 49% in Germany. The share of Japanese aged 15 to 64 fell from 70% to 59%.
- Had Japan kept its 1995 share of working-age people, its output per person would be about 19% higher, and of the six countries only Malta would be ahead of it.
GDP per person measures output, not wages. Please describe it as GDP per person at purchasing power parity, not as income or pay.
Questions, corrections or another cut of the data: [email protected].
The story's rent chart uses third-party city data and is not covered by this licence.
What these numbers don't sayOutput is not wages, and two other limits
- GDP per person measures output, not wages. A country can match Japan's output while its workers earn far less.
- All GDP figures are at purchasing power parity, so exchange-rate swings don't distort them.
- Taiwan is not in the World Bank data, so it can't appear here.
Sources and methodWorld Bank data, context sources, rent and pay
Economy
World Bank, World Development Indicators (CC BY 4.0), downloaded 2026-10-30. GDP per capita, PPP, constant 2021 international dollars (NY.GDP.PCAP.PP.KD); population (SP.POP.TOTL); population aged 15 to 64 (SP.POP.1564.TO); population aged 65 and over (SP.POP.65UP.TO.ZS). Download the chart data.
Context
- Older workers: Statistics Bureau of Japan via Nippon.com
- Retention-to-70 rule: Ministry of Health, Labour and Welfare
- Births: health ministry 2024 vital statistics
- Empty homes: 2023 Housing and Land Survey
- Foreign residents: Immigration Services Agency
- Korea's fertility rate: Statistics Korea
- Lithuania's population: OSW
Rent and pay
CrossBorders city data. Rent is the asking or newly agreed rent for a one-bedroom flat; pay is average local earnings from national statistics, converted to net for a single person with no children. Each city's sources are on its city page; the method is on our methodology page. Amounts are shown in US dollars at the ECB reference rate of 29 October 2026 ($1.113 per euro).