Research · Data as of November 6, 2026
We looked at 178,637 apps that appeared in the App Store top charts of 173 countries and regions since October 9, 2026. Here are the answers to five questions.
Key findings
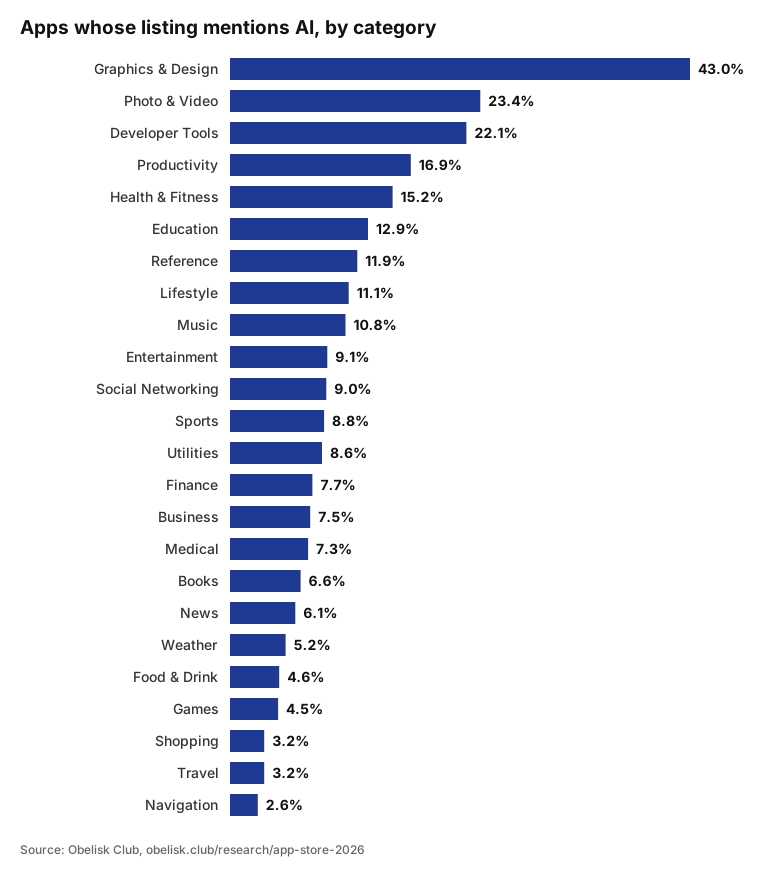
- About 1 in 10 apps in the charts mention AI in their store listing (9.8%); in Graphics & Design it is 43%.
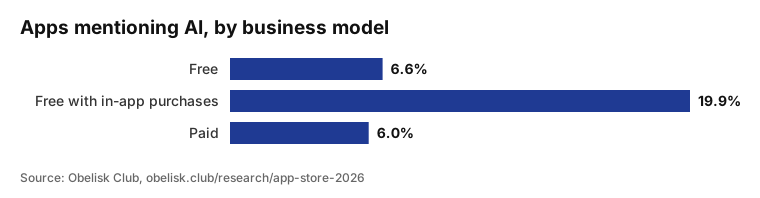
- Apps that sell in-app purchases or subscriptions are 3 times as likely to mention AI as plain free apps (19.9% vs 6.6%).
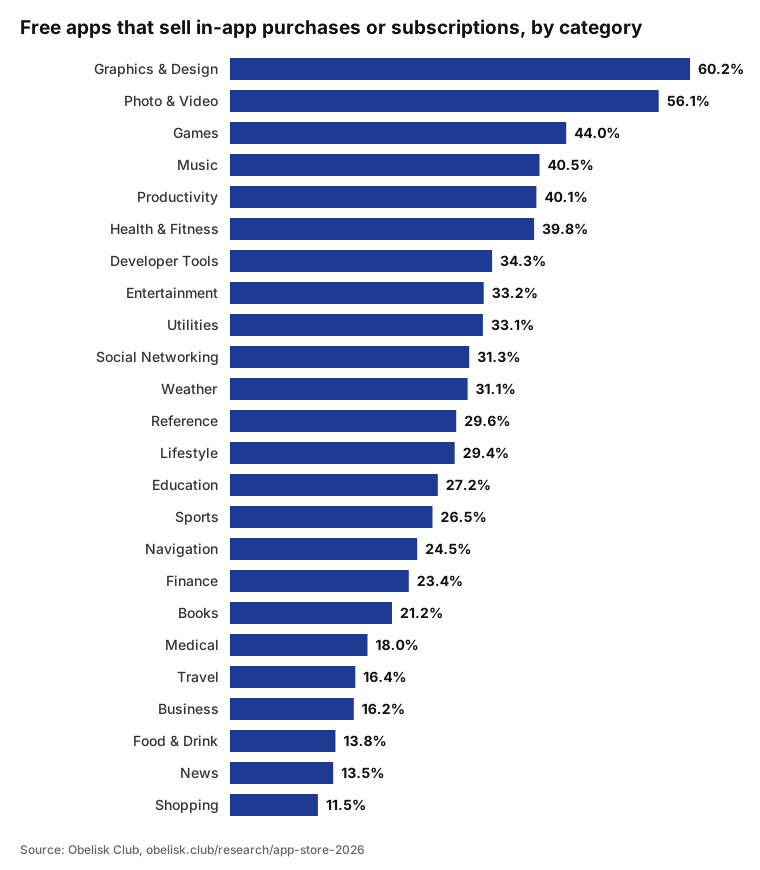
- 26.7% of free-to-download apps sell in-app purchases or subscriptions; most in Graphics & Design (60.2%), fewest in Shopping (11.5%).
- 20.3% of apps in the charts have not been updated for a year or more; 9.8% for over three years.
- In 1-2 star reviews the most common complaint is subscription & price (12.7%), ahead of bugs & broken features (10.9%) and login & account (10%).
1. How many apps talk about AI
17,456 apps (9.8%) mention AI, GPT, machine learning, generative or chatbot in their name or the start of their description. They cluster in Graphics & Design, Photo & Video and Developer Tools. Ratings barely differ: among apps with at least 50 ratings, those mentioning AI average 4.49 stars and the rest 4.4.
Show the numbers
| Category | Apps | Share |
|---|---|---|
| Graphics & Design | 2,644 | 43.0% |
| Photo & Video | 5,073 | 23.4% |
| Developer Tools | 2,183 | 22.1% |
| Productivity | 7,671 | 16.9% |
| Health & Fitness | 9,695 | 15.2% |
| Education | 15,799 | 12.9% |
| Reference | 5,867 | 11.9% |
| Lifestyle | 8,676 | 11.1% |
| Music | 4,399 | 10.8% |
| Entertainment | 7,167 | 9.1% |
| Social Networking | 4,332 | 9.0% |
| Sports | 8,704 | 8.8% |
| Utilities | 7,795 | 8.6% |
| Finance | 11,266 | 7.7% |
| Business | 9,899 | 7.5% |
| Medical | 7,034 | 7.3% |
| Books | 5,626 | 6.6% |
| News | 6,979 | 6.1% |
| Weather | 2,942 | 5.2% |
| Food & Drink | 9,202 | 4.6% |
| Games | 7,325 | 4.5% |
| Shopping | 7,234 | 3.2% |
| Travel | 6,682 | 3.2% |
| Navigation | 5,400 | 2.6% |
2. How free apps make money
Of 164,056 free-to-download apps, 26.7% say in their description that they offer in-app purchases, a subscription, a trial or a Pro unlock. Graphics & Design and Photo & Video lead; Shopping and News come last; many of those are apps of businesses that most likely earn their money outside the app.
Show the numbers
| Category | Apps | Share |
|---|---|---|
| Graphics & Design | 2,583 | 60.2% |
| Photo & Video | 3,462 | 56.1% |
| Games | 5,425 | 44.0% |
| Music | 4,118 | 40.5% |
| Productivity | 5,542 | 40.1% |
| Health & Fitness | 8,227 | 39.8% |
| Developer Tools | 2,129 | 34.3% |
| Entertainment | 5,840 | 33.2% |
| Utilities | 7,253 | 33.1% |
| Social Networking | 4,074 | 31.3% |
| Weather | 2,903 | 31.1% |
| Reference | 5,790 | 29.6% |
| Lifestyle | 8,401 | 29.4% |
| Education | 12,669 | 27.2% |
| Sports | 8,550 | 26.5% |
| Navigation | 5,323 | 24.5% |
| Finance | 10,465 | 23.4% |
| Books | 5,573 | 21.2% |
| Medical | 6,979 | 18.0% |
| Travel | 6,612 | 16.4% |
| Business | 9,795 | 16.2% |
| Food & Drink | 9,148 | 13.8% |
| News | 6,950 | 13.5% |
| Shopping | 7,223 | 11.5% |
3. How much of the charts independent developers hold
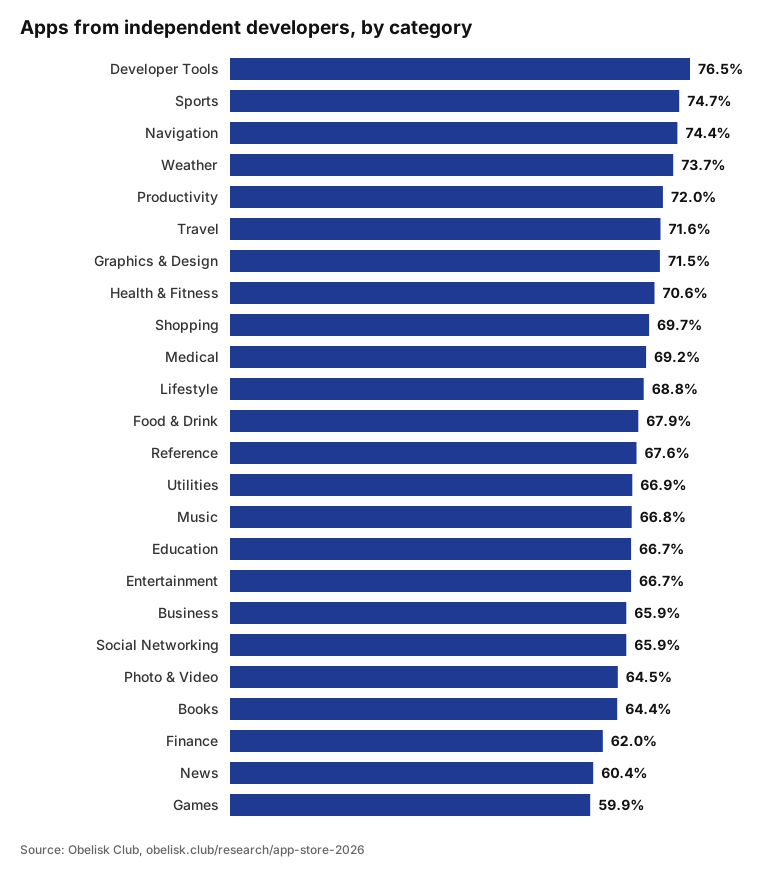
By our definition (see the notes below), 67.3% of apps in the charts come from independent developers. Their ratings match the larger publishers': 4.41 against 4.41 stars for apps with at least 50 ratings. The share is highest in Developer Tools, Sports and Navigation and lowest in Games.
Show the numbers
| Category | Apps | Share |
|---|---|---|
| Developer Tools | 2,183 | 76.5% |
| Sports | 8,704 | 74.7% |
| Navigation | 5,400 | 74.4% |
| Weather | 2,942 | 73.7% |
| Productivity | 7,671 | 72.0% |
| Travel | 6,682 | 71.6% |
| Graphics & Design | 2,644 | 71.5% |
| Health & Fitness | 9,695 | 70.6% |
| Shopping | 7,234 | 69.7% |
| Medical | 7,034 | 69.2% |
| Lifestyle | 8,676 | 68.8% |
| Food & Drink | 9,202 | 67.9% |
| Reference | 5,867 | 67.6% |
| Utilities | 7,795 | 66.9% |
| Music | 4,399 | 66.8% |
| Education | 15,799 | 66.7% |
| Entertainment | 7,167 | 66.7% |
| Business | 9,899 | 65.9% |
| Social Networking | 4,332 | 65.9% |
| Photo & Video | 5,073 | 64.5% |
| Books | 5,626 | 64.4% |
| Finance | 11,266 | 62.0% |
| News | 6,979 | 60.4% |
| Games | 7,325 | 59.9% |
4. How many apps are no longer maintained
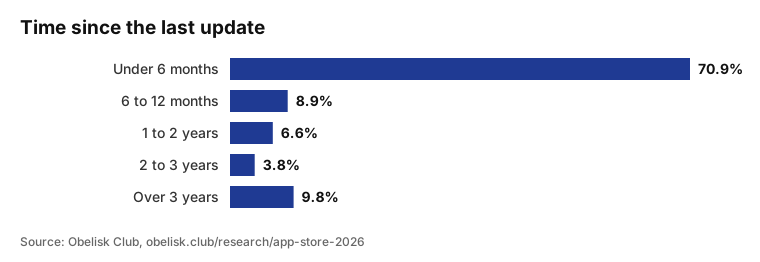
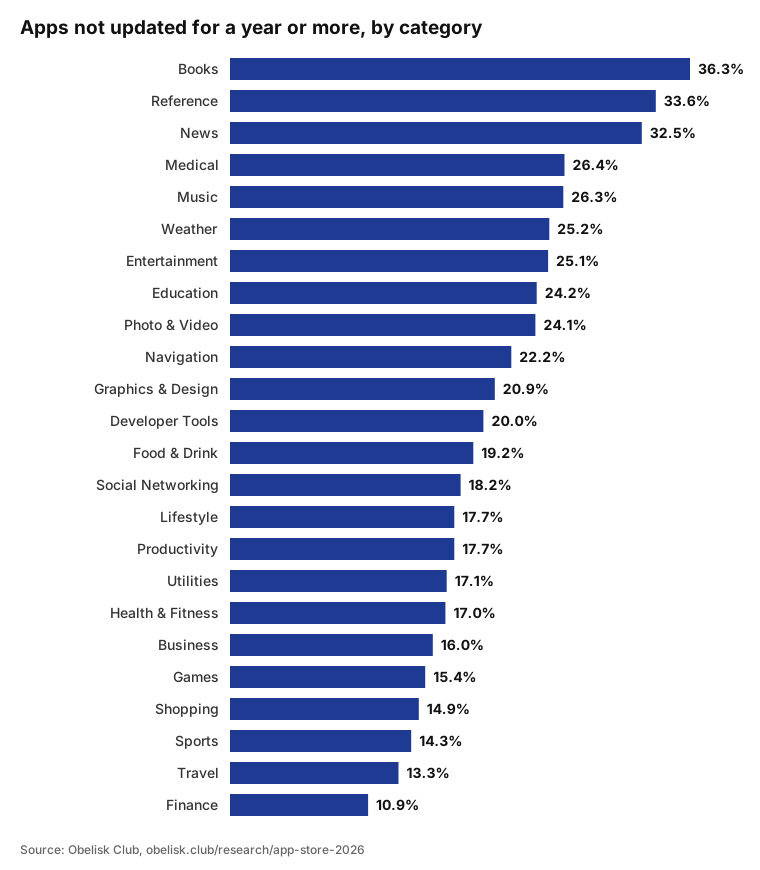
70.9% of apps in the charts were updated in the last six months, yet 20.3% have gone a year or more without an update and 9.8% more than three years. Books, Reference and News have the most apps left alone; Finance the fewest (10.9%).
Show the numbers
| Category | Apps | Share |
|---|---|---|
| Books | 5,626 | 36.3% |
| Reference | 5,867 | 33.6% |
| News | 6,979 | 32.5% |
| Medical | 7,034 | 26.4% |
| Music | 4,399 | 26.3% |
| Weather | 2,942 | 25.2% |
| Entertainment | 7,167 | 25.1% |
| Education | 15,799 | 24.2% |
| Photo & Video | 5,073 | 24.1% |
| Navigation | 5,400 | 22.2% |
| Graphics & Design | 2,644 | 20.9% |
| Developer Tools | 2,183 | 20.0% |
| Food & Drink | 9,202 | 19.2% |
| Social Networking | 4,332 | 18.2% |
| Lifestyle | 8,676 | 17.7% |
| Productivity | 7,671 | 17.7% |
| Utilities | 7,795 | 17.1% |
| Health & Fitness | 9,695 | 17.0% |
| Business | 9,899 | 16.0% |
| Games | 7,325 | 15.4% |
| Shopping | 7,234 | 14.9% |
| Sports | 8,704 | 14.3% |
| Travel | 6,682 | 13.3% |
| Finance | 11,266 | 10.9% |
5. What bad reviews complain about
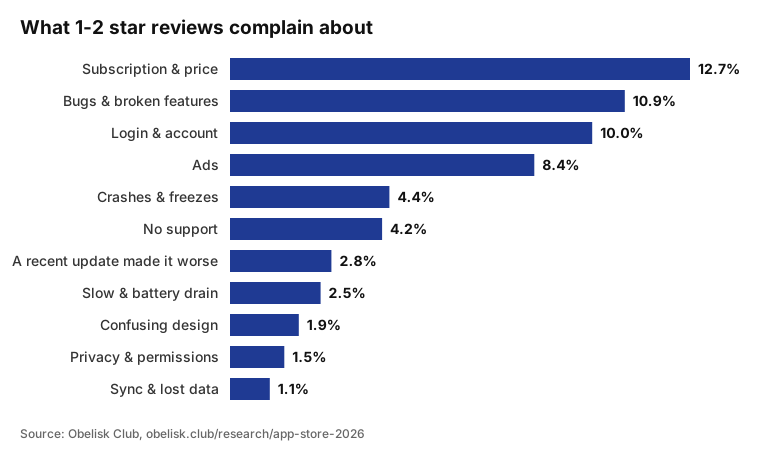
We read 165,735 US App Store reviews of 3,912 apps. Among 1-2 star reviews, 12.7% complain about subscription & price, 10.9% about bugs & broken features and 10% about login & account. One review can fall under several themes.
Next edition
We will refresh this report every quarter. From the next edition it will show change over time: which apps moved to subscriptions, how fast the AI share grows, and whether abandoned apps come back.
How to read these numbers
- Scope: 178,637 iPhone, iPad and Mac apps that appeared in an App Store top chart since October 9, 2026. In 12 large markets that means the overall and category charts for free, paid and top grossing apps; elsewhere the overall free chart. Apps never seen in a chart are left out.
- Categories: the app's primary App Store category, with names in other languages merged. Categories with fewer than 1,500 apps have no row of their own.
- Mentions AI: the name or the first 1,500 characters of the description contain AI, GPT, artificial intelligence, machine learning, generative, LLM or chatbot. It shows the app markets itself with AI, not that its features depend on it.
- Sells in-app purchases or subscriptions: free to download, and the description mentions a subscription, in-app purchase, premium, trial, unlock, Pro or a monthly or yearly price. Apps that say nothing may still sell something, so this share is on the low side.
- Independent developer: at most 5 of the developer's apps seen in the charts, no app with 30,000 ratings or more, and a seller name that does not read as a company (Inc, Corp, GmbH and the like). We only see apps that charted, so this share may run high.
- Last update: the release date of the current version on the US App Store.
- Reviews: recent public reviews on the US App Store. Themes come from keywords (for example subscription, ads, crash); shares are of 1-2 star reviews, except feature requests, which are of all reviews. Recent reviews lean negative, so we do not publish the overall share of bad reviews.
- Ratings: only apps with at least 50 ratings count.
Cite and download
The charts and data are free to use, commercial use included (CC BY 4.0). Please credit “Obelisk Club” and link to this page.
Suggested citation
Obelisk Club, “App Store 2026 in numbers”, November 6, 2026, https://obelisk.club/research/app-store-2026